
Prism study: Perpetua analysis reveals the power of market and competitive intelligence data
Stephen Bench-Capon, February 16, 2023
Want to define your own markets?
You can sign up today for access to Prism and be one of the first to use our Markets feature and experience the power of market-aware advertising.
Market-aware advertising driven by best-in-class intelligence will soon be a core part of every successful brand's eCommerce strategy. Prism, our market and competitive intelligence tool, empowers advertisers by making them truly market-aware. Below, we showcase a selection of analyses and insights that demonstrate the potential of Prism-powered data and how it can use it to improve the impact of your advertising.
What's in the study?
Our first Prism study focuses on two main Amazon categories. These categories are used to provide a high-level demonstration of the available data and insights that brands and advertisers can extract to better understand their relevant market.
The categories covered in this study are:
We have also provided an executive summary, an annex that includes more details on the data and methodology used throughout the study, and a glossary of key terms.
Want to do your own analysis?
You can sign up today for a Prism demo and get first-hand experience of how to leverage the power of market-aware advertising.
Executive Summary
Here is a selection of some of the study's key findings using data from Q4 2022:
We reveal the top 10 brands in two Amazon.com categories—Patio, Lawn & Garden, and Health & Household:
The two front-running brands in the Patio, Lawn & Garden category are Blackstone and Best Choice Products;
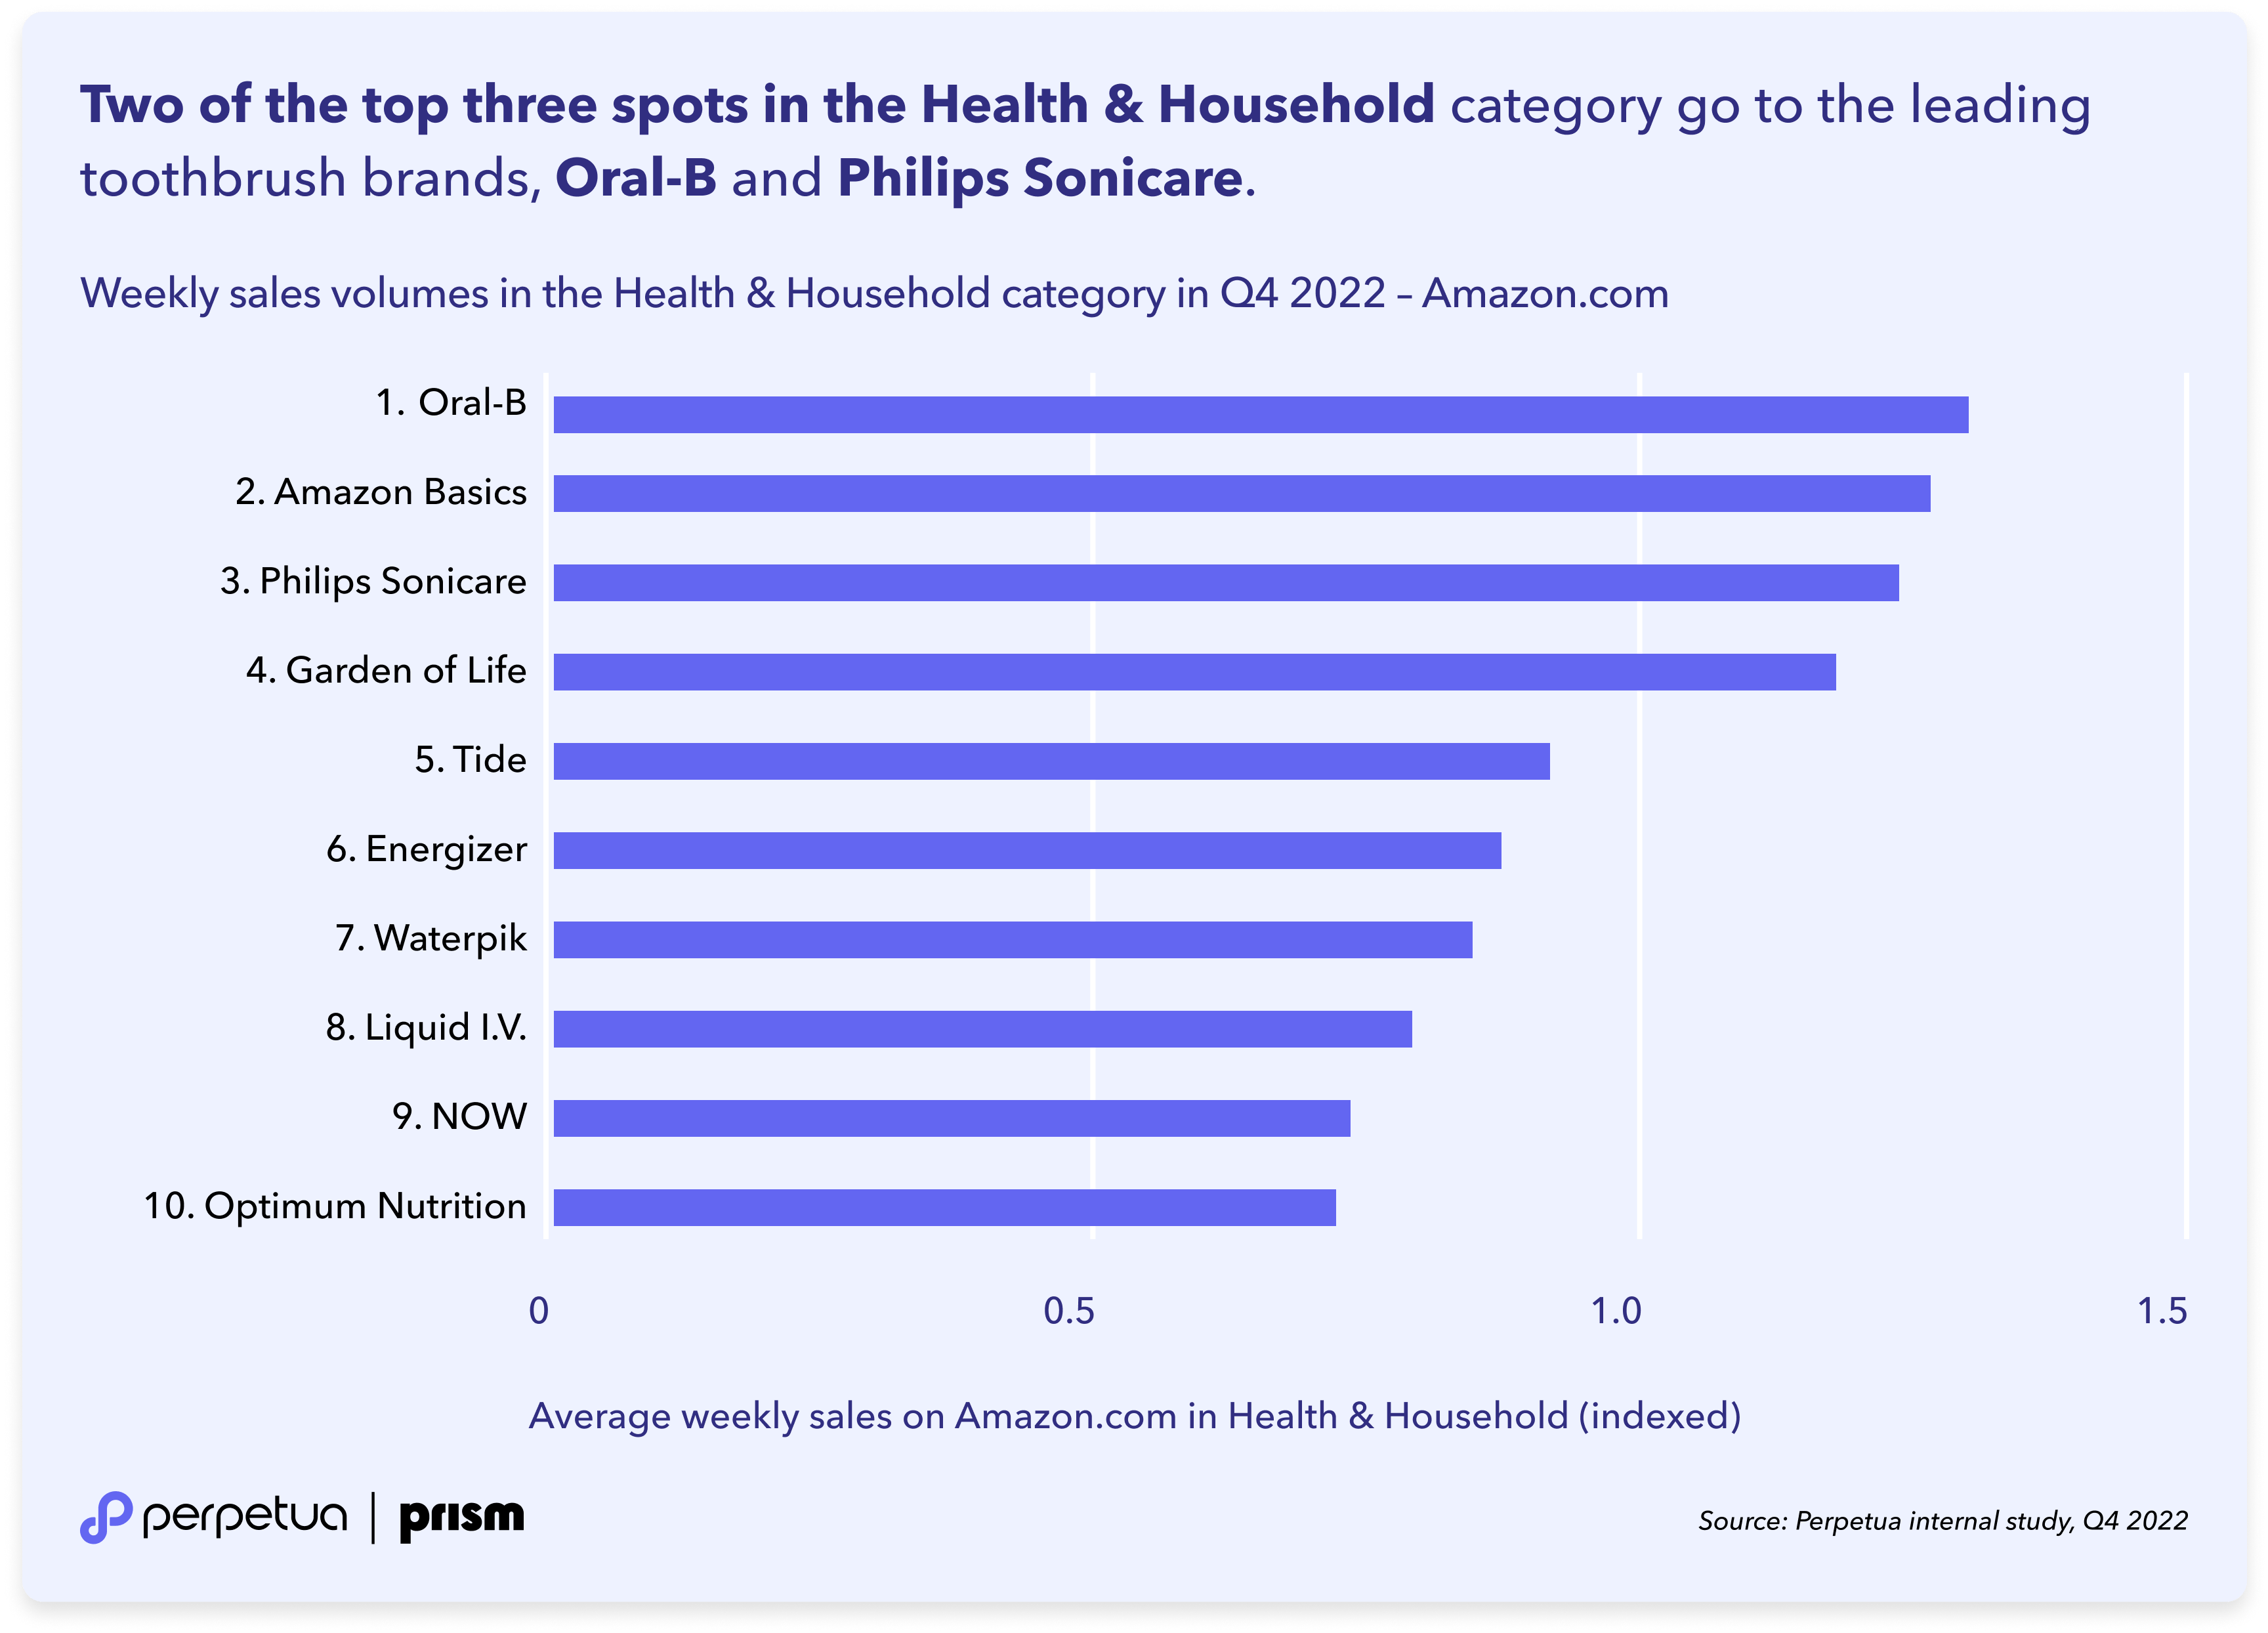
Two of the top three spots in the Health & Household category go to the leading toothbrush brands, Oral-B and Philips Sonicare.
Our analysis dives further into each category, providing a breakdown of the biggest subcategories:
Over a fifth of sales in the Patio, Lawn & Garden category are generated in the Gardening & Lawn Care subcategory;
Health & Household sales are concentrated in just six large subcategories with over 25% produced by Vitamins, Minerals & Supplements.
Looking across Q4, we identify some seasonal trends:
Subcategories within Patio, Lawn & Garden saw a huge sales spike the week of the Prime Early Access Sale (11th-12th October), with between 46% and 120% week-over-week growth;
Sales in the Snow Removal category fluctuate wildly according to weather events, with a 100% increase the week of the Great Lakes winter storm;
The brand, Best Choice Products, generated and sustained impressive sales in the Outdoor Décor category by ramping up activity early ahead of Black Friday.
We analyze the sales distribution of different subcategories to understand how evenly volume is spread between larger and smaller brands:
Using the Gini coefficient as a measure of inequality, Oral Care skews more towards the biggest brands than Vitamins, Minerals and Supplements, with a Gini coefficient of 0.88.
Diving another level down into subcategories shows that Toothbrushes & Accessories make up almost 40% of Oral Care revenue, while the distribution across subcategories of Vitamins, Minerals & Supplements is much broader.
A study of best-selling ASINs in each category provides insight into the depth and breadth of different brands' product portfolios:
With our analysis conducted across Q4 2022, the best-selling Patio, Lawn & Garden ASIN is an Amazon Basics patio heater, with several Grills & Outdoor Cooking products also featuring in the top 20.
In Health & Household, Oral-B tops the overall sales volume charts without a single ASIN in the category top 20, profiting from a strong brand and a wide portfolio of products.
Those are just some of the main findings—read on for all the data, charts and full analysis. Enjoy!
Category analysis
A large part of understanding your market is being aware of the dynamics within your category. Our study goes into depth on two main Amazon categories:
For each category, our analysis begins with a high-level look at the top brands and a breakdown of the most important subcategories. This provides context for further exploration, which includes a look at how different brands perform from week to week, a closer analysis of the competitive environment within specific subcategories, and details on the bestselling ASINs.
Patio, Lawn & Garden
Patio, Lawn & Garden is a highly seasonal category with trends closely connected to the weather and time of year. e should emphasize up front that this study draws on data from Q4 2022. If we were to look at data from the springtime, the findings could—and should—be quite different.
Who are the top 10 Patio, Lawn & Garden brands by sales volume?
Looking at the Q4 2022 sales of the top 10 Patio, Lawn & Garden brands, we see that two brands, Blackstone and Best Choice Products, are some way ahead of the rest of the pack. These front-runners achieve index values of 1.62 and 1.35 respectively, where 1.0 is the average across the top 10. The other eight leading brands, headed up by EGO Power+, are all bunched closely together in terms of their Q4 2022 sales, with every brand in the top 10 for Patio, Lawn & Garden sales having an index value above 0.75.
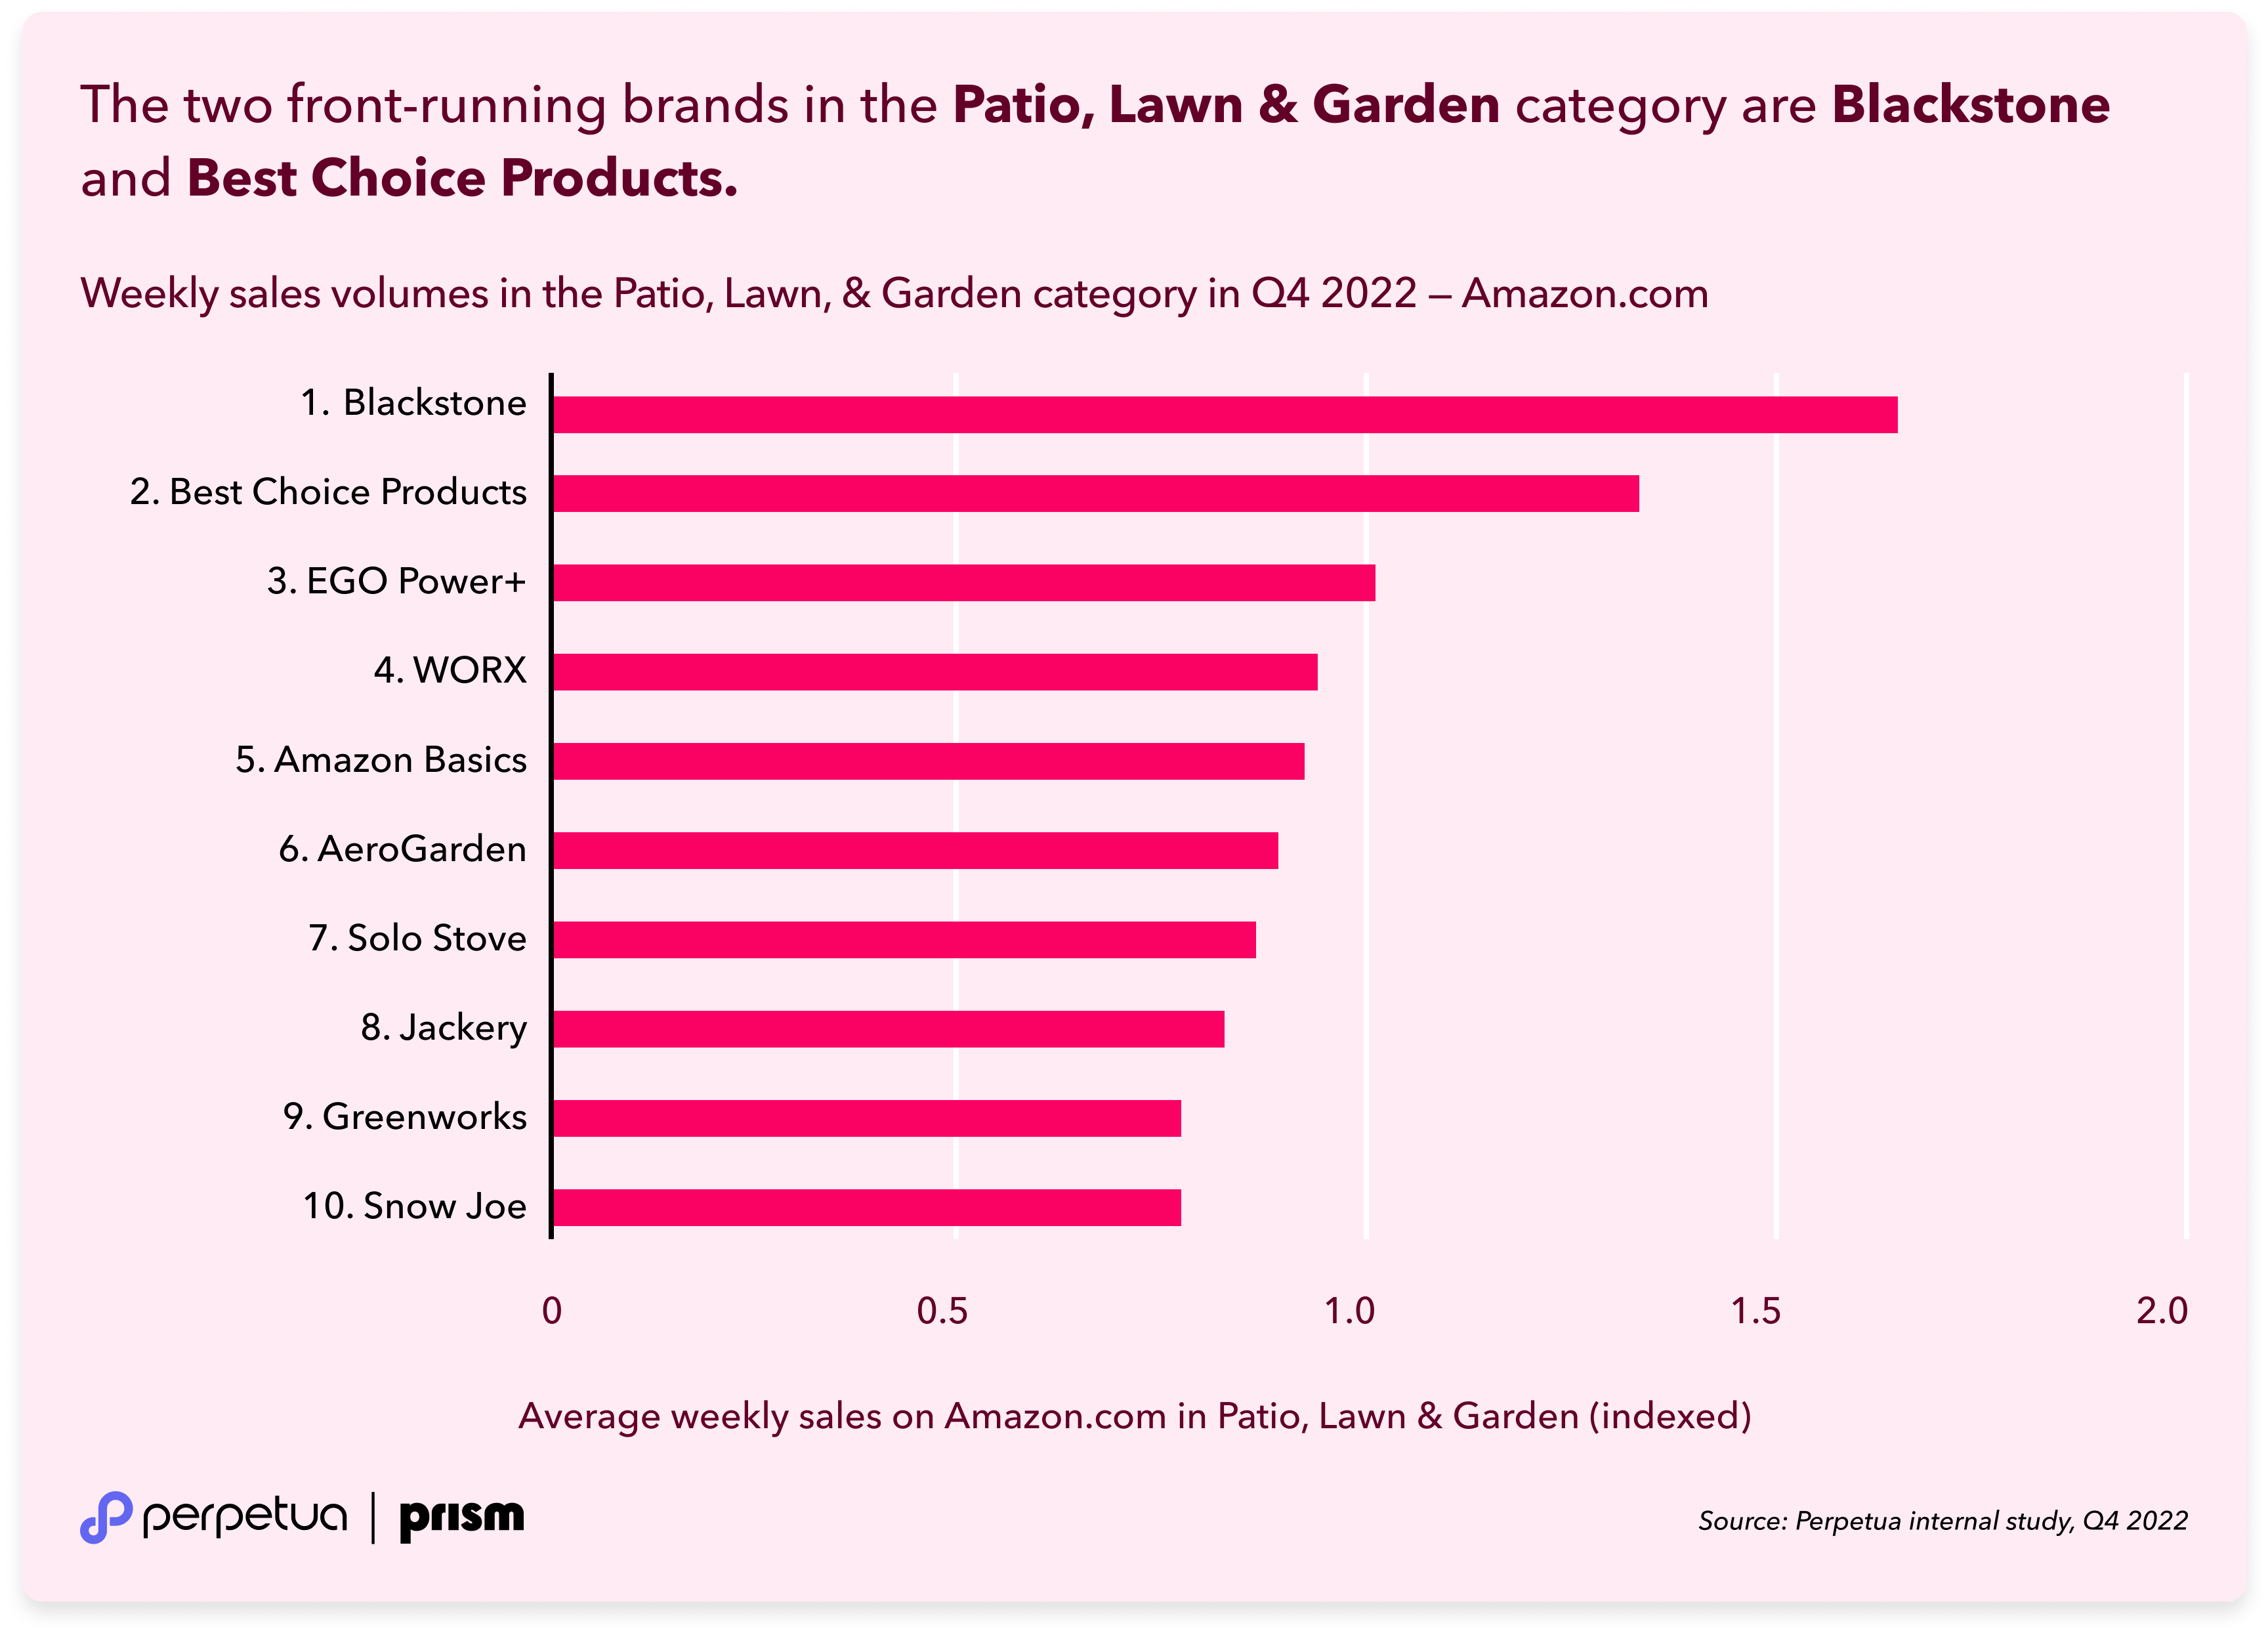
One interesting feature of the top 10 Patio, Lawn & Garden brands is the broad range of product categories offered. Blackstone, for example, is the only top 10 brand specializing in Grills & Outdoor Cooking. Weber, the second-largest brand in this segment, sits just outside the top 10 in 11th place within the Patio, Lawn & Garden category.
A notable exception is the Outdoor Power Tools subcategory, which has three representatives in the top 10: EGO Power+, WORX and Greenworks. The presence of three powerful brands, all generating around the same revenue in Q4 2022, suggests fierce competition and a more difficult environment for challenger brands to break into the top tier than in categories with fewer well-known competitors.
Key takeaways: Assessing the top brands in a category is a key part of market sizing. If you're weighing up investment in a business, knowing how much revenue the category leaders are generating gives you an idea of the maximum revenue potential. This helps you decide whether to invest here or elsewhere—and how much.
If your target market already has several high-powered players vying for top position, it will likely be harder to disrupt. In this situation, you should identify your brand's unique strengths—focus your Sponsored Brands ad targeting on specific, niche keywords that let you stand out and where competition won't be as extreme. Build your brand here first to create a platform from which you can grow and challenge the more established household names.
Which are the most important subcategories within Patio, Lawn & Garden?
The sales volumes of individual subcategories within Patio, Lawn & Garden shows that one subcategory, Gardening & Lawn Care is responsible for over a fifth of the total sales volume.
As discussed above, this data is from Q4 2022, meaning that consumers are purchasing products related to garden activities related to this time of year, and that a category like Pools, Hot Tubs & Supplies, for example, may well have a higher proportion of sales in the warmer months.
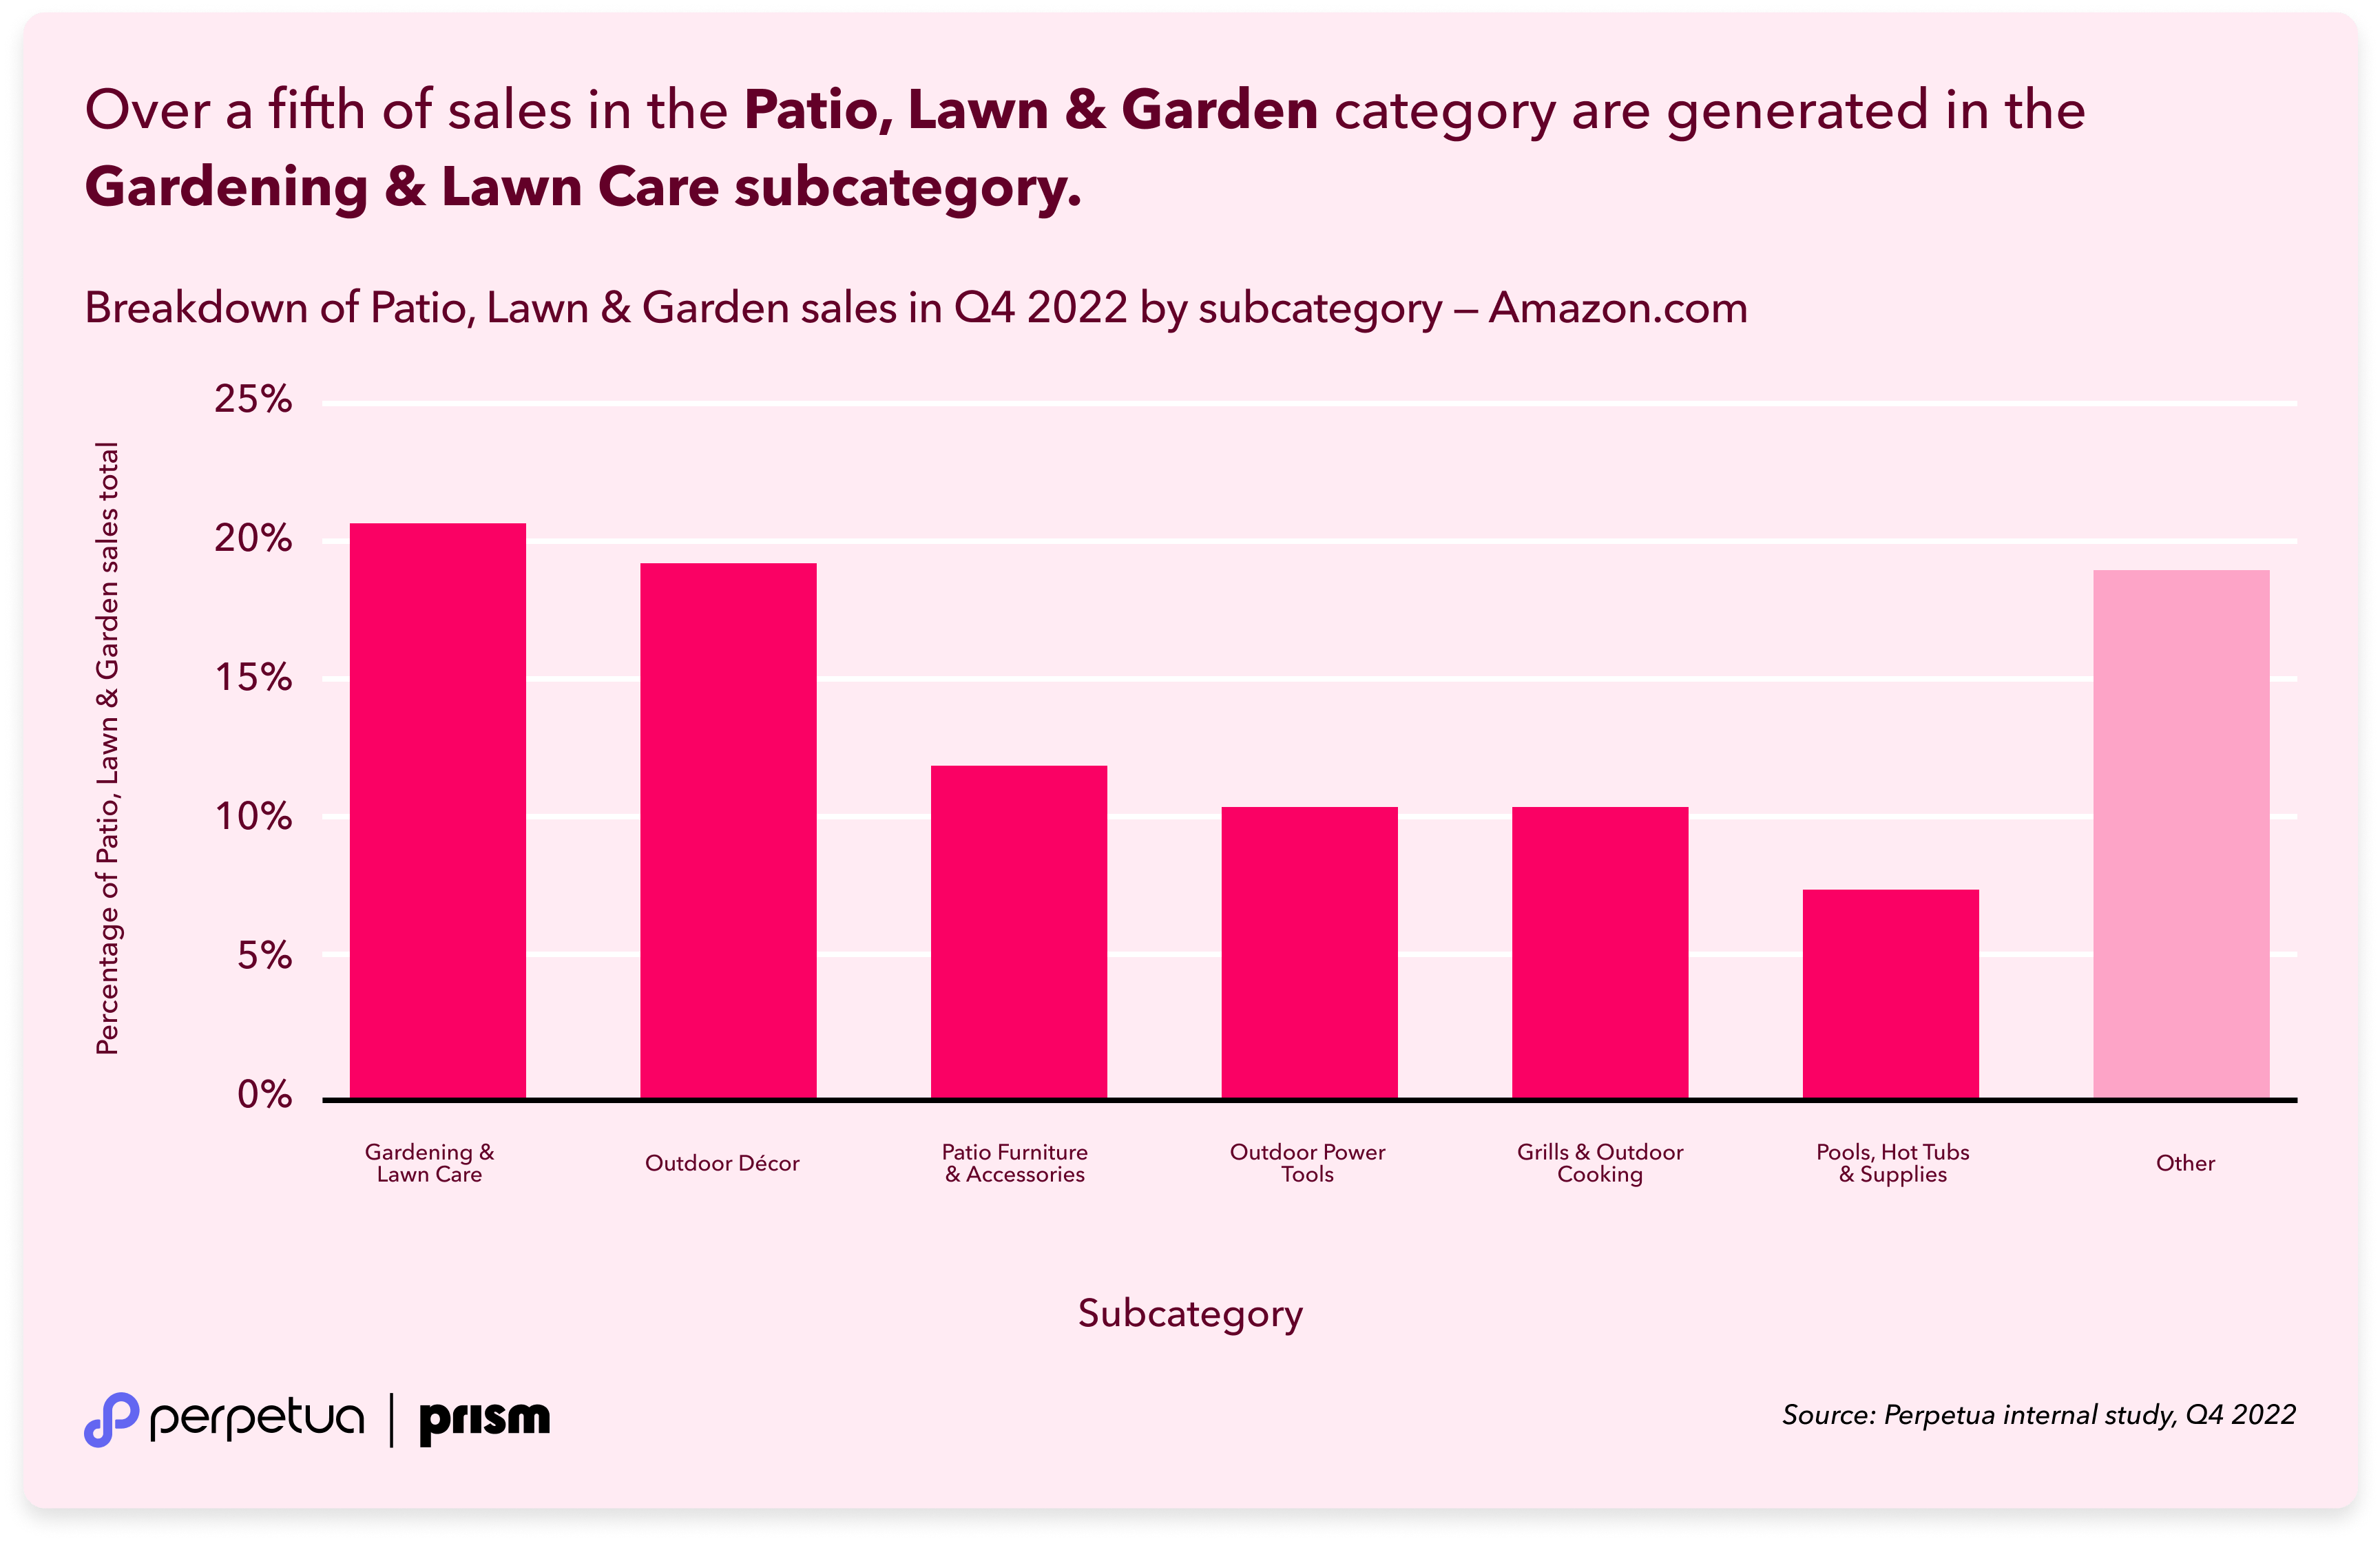
In terms of overall category structure, we see that there are five categories that each command at least 10% of total Patio, Lawn & Garden sales. This tallies with our analysis above, that identified a broad range of products sold by successful brands in Patio, Lawn & Garden space.
Take action: Review the sales volumes of your products' subcategories to better understand the relative market sizes. This will help you allocate your advertising budget in line with the revenue potential of different segments. For example, if your product range is split 50/50 between Patio Furniture & Accessories and Outdoor Decór, this doesn't mean your budget should be divided evenly. The Outdoor Decór category is 60% larger, which means 60% more potential sales you could be generating with targeted ad spend. These are vital considerations to make when developing an advanced Amazon PPC strategy.
Impact of seasonality in the Patio, Lawn & Garden category
Seasonality plays a key role across eCommerce. To be successful, advertisers need strategies for major events like Amazon Prime Day, the Q4 holiday shopping season, or other category-specific periods when consumer demand peaks.
The Patio, Lawn & Garden category is no different, with seasonality—in a very literal sense—having a significant impact on product demand. The chart shows week-over-week growth in three subcategories. Note here that the Prime Early Access Sale (PEAS) took place in the week commencing 9th October, and Black Friday was in the week of 20th November
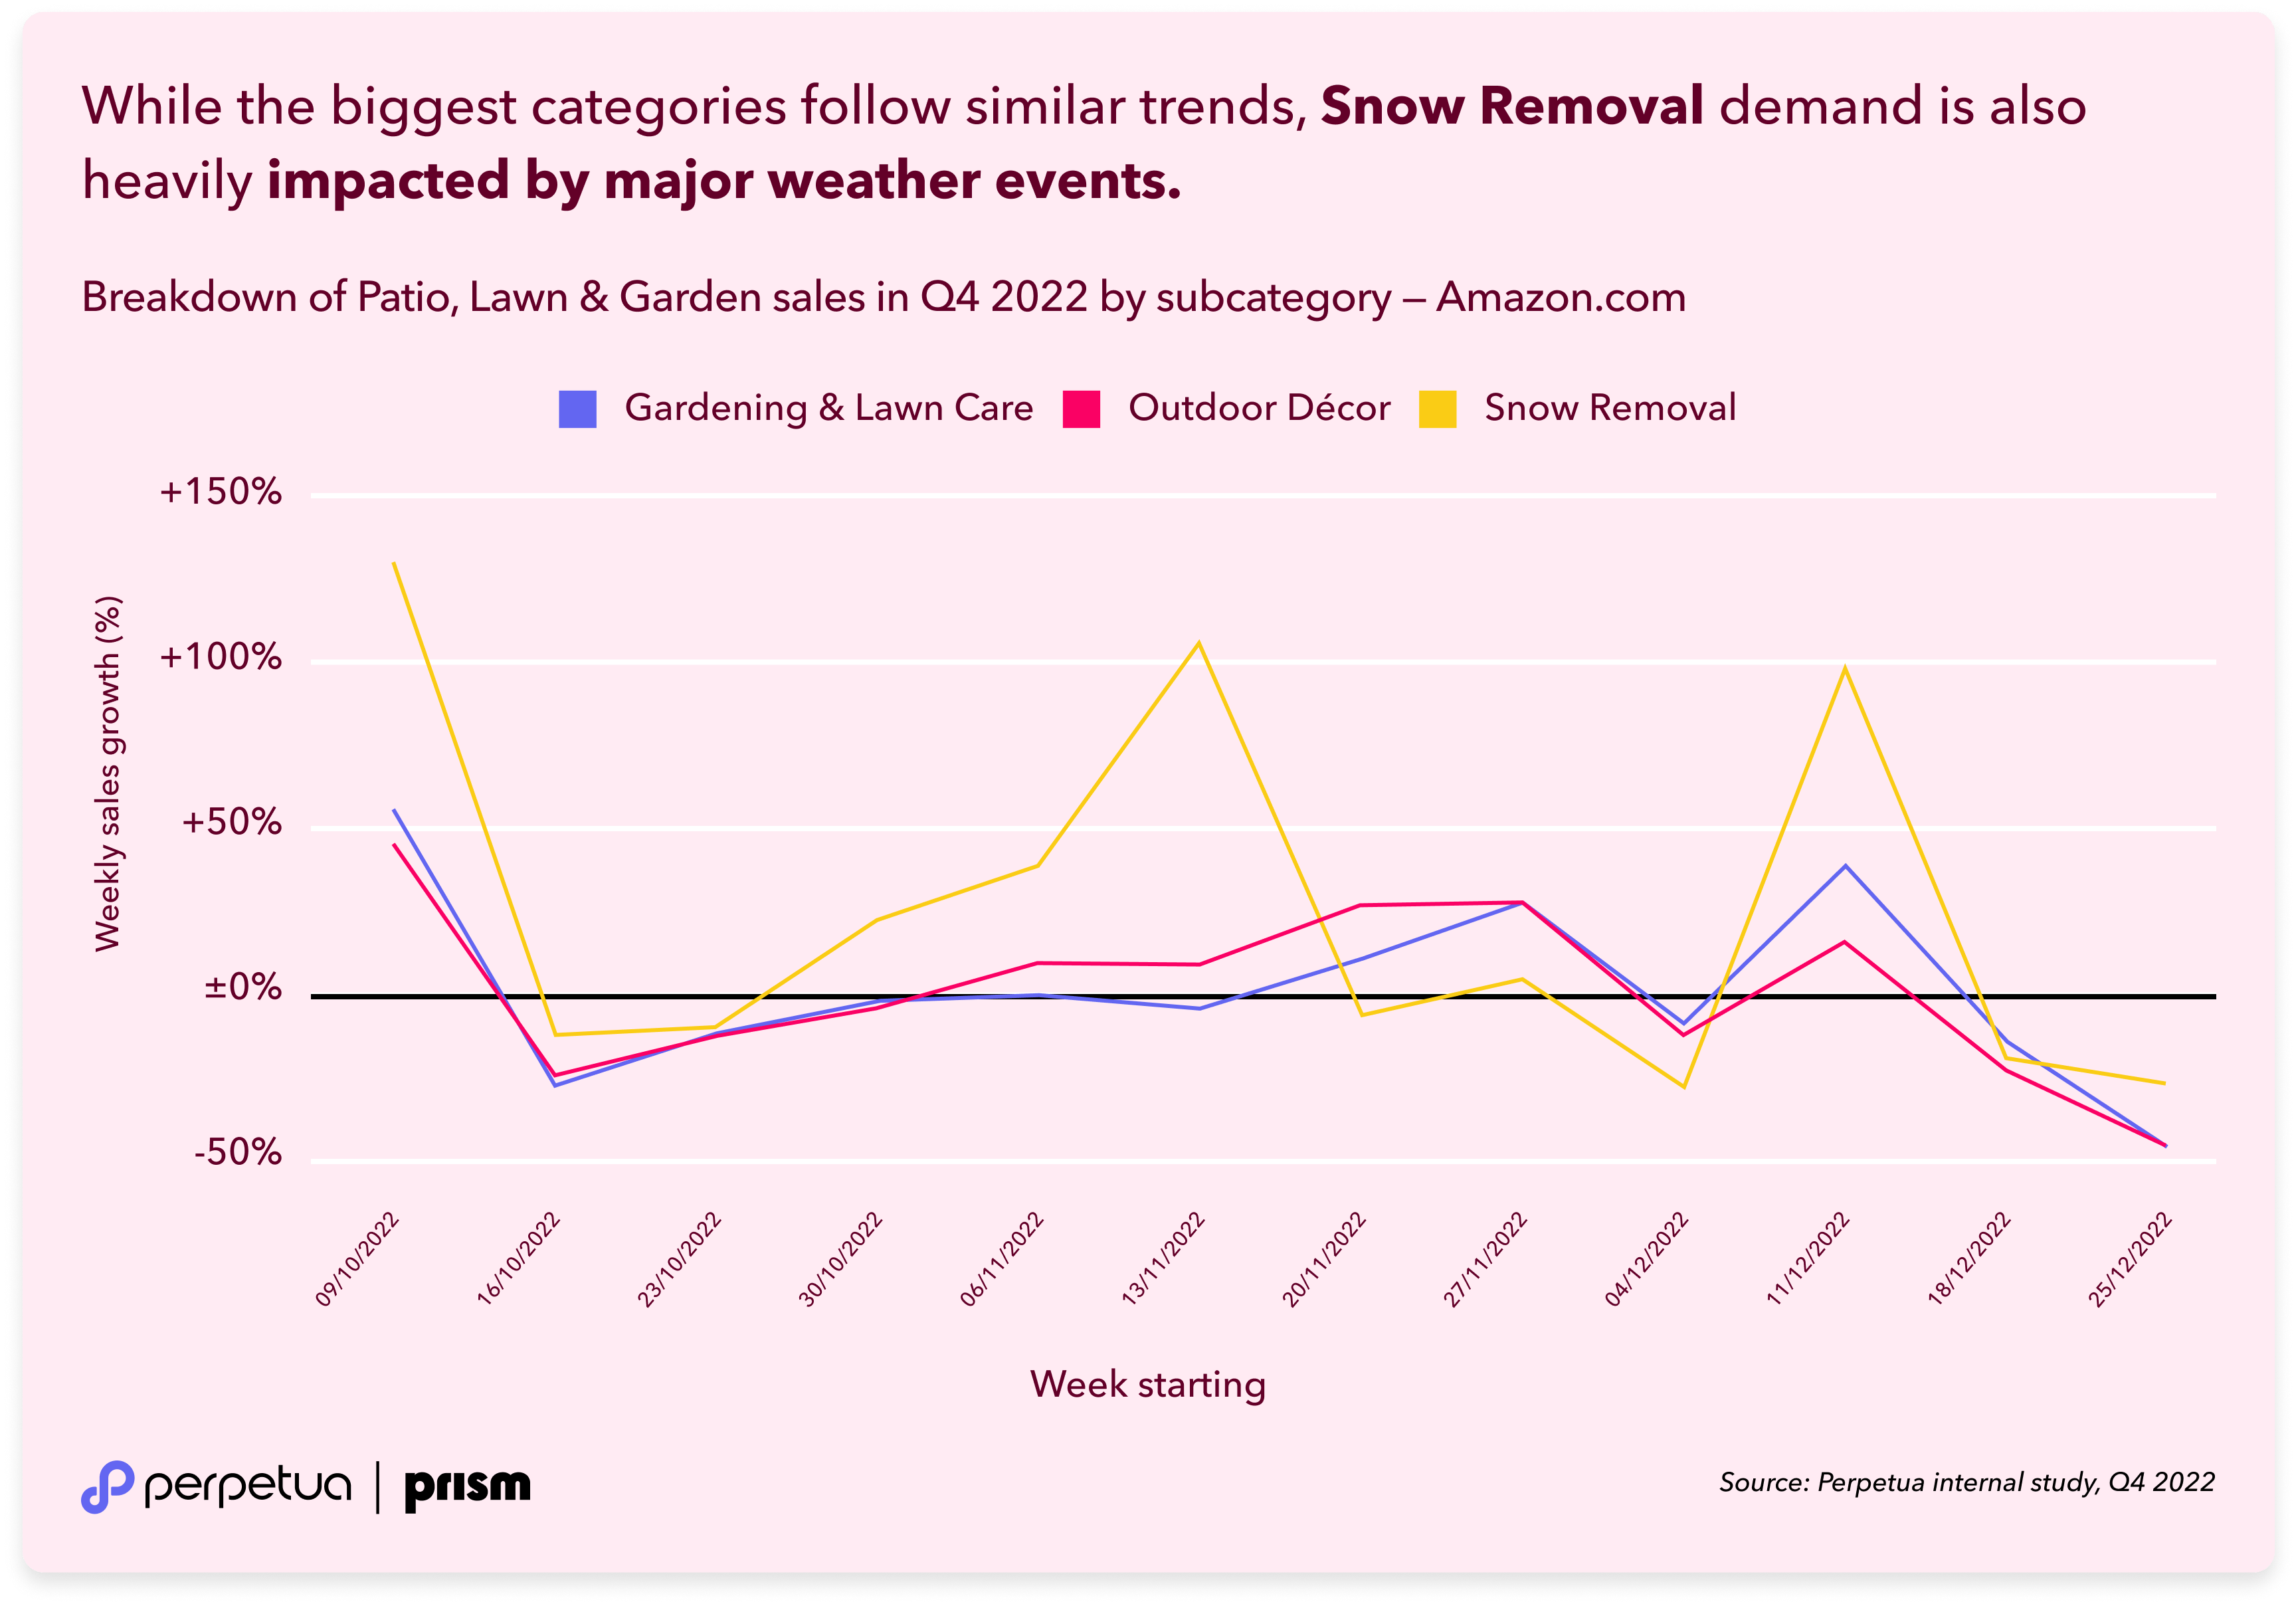
All three categories saw a large spike in the week of the Prime Early Access Sale, and further growth in the weeks of, and after Black Friday. While the two largest categories, Gardening & Lawn Care and Outdoor Décor, follow much the same pattern, sales for Snow Removal products shot up over 100% in the week of 13th November, which seems odd at first glance.
But there's an easy explanation. The 16th of November saw the start of the Great Lakes winter storm. Demand for Snow Removal products doesn't wait around for Black Friday deals.
Key takeaway: If you're selling in a category that is closely connected to weather or other short-notice, instant-impact events, you need to be highly flexible in your advertising and ready to take advantage the moment the opportunity comes. Use an automated solution to boost high-demand keywords instantly and don't be shy about increasing your budget. Aggressive targeting of top-of-search placements can bring huge returns in the short term, and also get your brand in front of a new audience and expand your long-term customer base.
Early investment pays dividends
Sticking with seasonality, Black Friday weekend is a big opportunity for Amazon advertisers in many categories to generate large returns as shoppers look for the best deals. If we look at some of the biggest brands in the Outdoor Décor category, we see an interesting result for Best Choice Products. While their two largest Outdoor Décor competitors, Joiedomi (+104%) and Gemmy (+77%), both saw sales increase in Black Friday Week (20th November), Best Choice Products' largest spike came the week before, with 147% week-over-week growth.
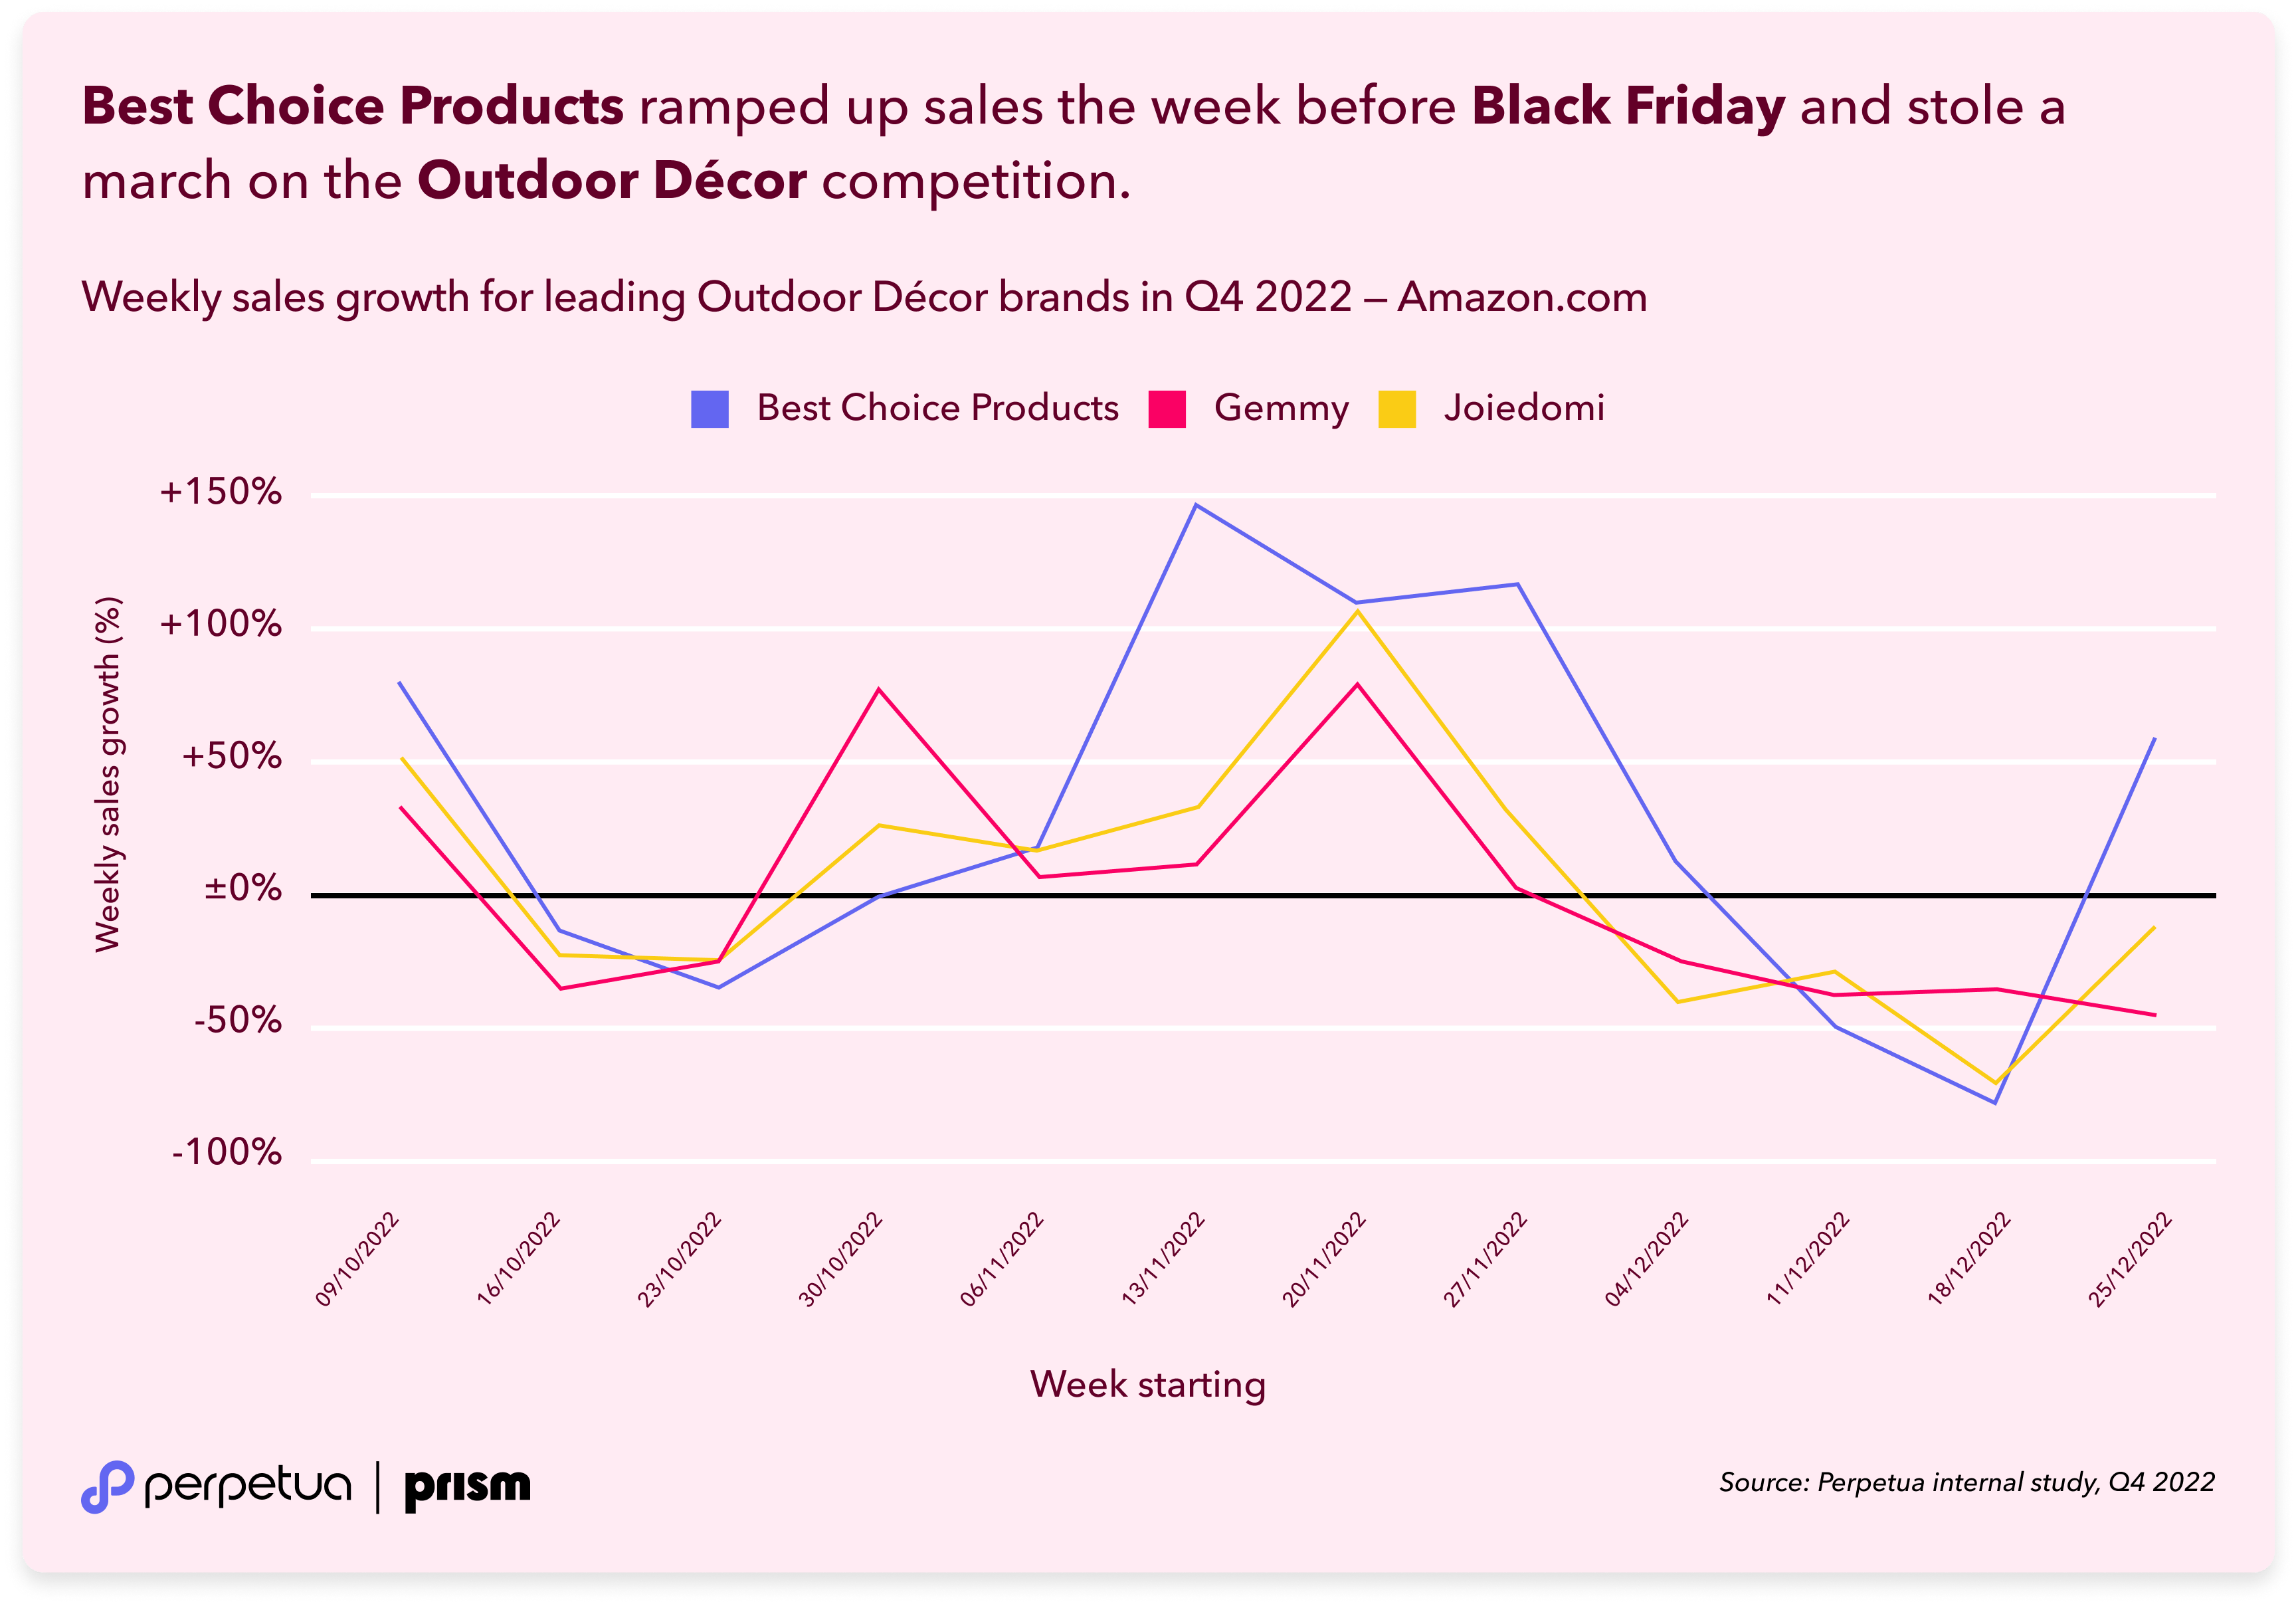
This data suggests that Best Choice Products went hard and went early with their (pre-)Black Friday push, and were able to capitalize on increased demand before their competitors followed suit. This created not only an initial boost, but one that saw sustained benefits. Best Choice Products went from having around 20-25% the sales of their competitors at the start of Q4 to catching up and even outselling both Gemmy and Joiedomi in the Outdoor Décor category in the week of December 4th.
Take action: Don't wait around for your competitors to increase their ad spend to be aggressive with yours. By raising your budget when competition is still (comparatively) low, you can see a disproportionate boost in your own sales that can bring long-lasting rewards. Track category trends to anticipate consumer demand and ramp up your ad spend preemptively—this way you'll be top-of-mind for seasonal products the moment customers are ready to purchase.
Looking for the latest trends?
Sign up for a Prism demo today and see first-hand how you can analyze seasonal trends, with new data released every week.
What are the best-selling Patio, Lawn & Garden ASINs?
This table shows the top 20 ASINs with the highest average weekly sales volume in the Patio, Lawn & Garden category.
Rank | ASIN | Brand | Title | Subcategory |
|---|---|---|---|---|
1 | Amazon Basics | Amazon Basics 46,000 BTU Outdo ... | Outdoor Heating & Cooling | |
2 | Jackery | Jackery Portable Power Station ... | Generators & Portable Power | |
3 | Blackstone | Blackstone 36" Cooking Station ... | Grills & Outdoor Cooking | |
4 | EGO Power+ | EGO Power+ LB6504 650 CFM Vari ... | Outdoor Power Tools | |
5 | LEISURE TIME | Leisure Time E5-02 Spa 56 Chlo ... | Pools, Hot Tubs & Supplies | |
6 | Traeger | Traeger Grills Cherry 100% All ... | Grills & Outdoor Cooking | |
7 | MacSports | MAC SPORTS WTC-111 Outdoor Uti ... | Gardening & Lawn Care | |
8 | DuroMax | DuroMax XP10000E Gas Powered P ... | Generators & Portable Power | |
9 | CreoleFeast | CreoleFeast TFS3010 Propane 30 ... | Grills & Outdoor Cooking | |
10 | Champion Power Equipment | Champion Power Equipment 20098 ... | Generators & Portable Power | |
11 | Gorilla Grip | Gorilla Grip All-Season Weathe ... | Outdoor Décor | |
12 | Snow Joe | Snow Joe 24V-X2-SB18 18-Inch, ... | Snow Removal | |
13 | Masterbuilt | Masterbuilt MB20071117 Digital ... | Grills & Outdoor Cooking | |
14 | Solo Stove | Solo Stove Bonfire with Stand ... | Outdoor Heating & Cooling | |
15 | SUPERthrive | SUPERthrive VI30179 Plant Vita ... | Gardening & Lawn Care | |
16 | Gardesol | Gardesol Carport, 12'x20' Extr ... | Outdoor Storage & Housing | |
17 | Char-Broil | Char-Broil Big Easy Oil-less L ... | Grills & Outdoor Cooking | |
18 | BLUETTI | BLUETTI Portable Power Station ... | Generators & Portable Power | |
19 | Char-Broil | Char-Broil Big Easy Oil-less L ... | Grills & Outdoor Cooking | |
20 | Westinghouse Outdoor Power Equipment | Westinghouse 2500 Watt Super Q ... | Generators & Portable Power |
The number one Patio, Lawn & Garden ASIN in Q4 2022 was a patio heater from Amazon Basics. This ASIN's huge sales volume makes up more than half of the brand's Patio, Lawn & Garden total, and is largely to thank for Amazon Basics' 5th place in the list of top brands.
Blackstone, the leading brand in the category, also had a clear hero product in Q4 2022 in their 36" Cooking Station. By contrast, Best Choice Products, the brand with the second-highest sales volume in Q4 2022, don't have a single representative in the top 20. Their best-selling ASIN comes in at number 45, though they then have another four products in the top 200.
These differences underline that there is no single strategy for success in this category. Some of the most successful brands have wide product portfolios, while others are heavily invested in just a few ASINs—or even just one. Add to this the impact of seasonality on Patio, Lawn & Garden products, and we have a category that is wide open, full of opportunities for breakthrough brands—or even individual products—to capture an increased share of consumer demand.
Take action: Review the bestselling ASINs in your category—and identify candidates for competitor targeting. A suitable target is a bestseller that is either a direct competitor or potential complementary product for one of your ASINs. With ASIN targeting, you can appear on the product detail page and in direct ASIN searches, where you'll be sure to get a high volume of impressions and likely capture some of this sales potential for yourself.
ASIN targeting can seem daunting if approached manually, which is why many advertisers opt for an Ad Engine like Perpetua's that can identify, test and optimize ASIN targets for the best results.
Patio, Lawn & Garden: segmentation matters
One recurring theme throughout this analysis of the Patio, Lawn & Garden category has been how broad the product range is. This Amazon category—like most top-level categories—brings together several areas that are at times only loosely related. The big picture provides important context, but there is also value in focusing your analysis on the most relevant section of the market for your brand.
With Prism, you can build a market comprised of highly relevant ASINs based on one or more of the following criteria:
a list mandatory keywords in the product title (AND logic)
a list of possible keywords in the product title (ANY logic)
specific categories (at any level) to include (or choose to include ASINs all categories)
specific brands to include (or choose to include all ASINs from all brands)
weekly sales volume (define min. and max.)
average rating (define min and max.)
average number of reviews (define min and max.)
price range (define min. and max. average price)
exclusion ASINs (specific products you do not want included in your market)
As an example, you might sell power tools and find that a focus on Amazon's Outdoor Power Tools category excludes a lot of potential keywords and competitors from Tools & Home Improvement. Prism's filters enable you to analyze and track a market defined according to your priorities. With custom markets, you can understand your competitors in great detail and execute market-aware advertising campaigns, such as expanding your brand-building advertising to areas where you are currently underrepresented and losing out on sales to your rivals.
Want to define your own markets?
You can sign up today for access to Prism and be one of the first to use our Markets feature and experience the power of market-aware advertising.
Health & Household
In this section, we're looking at market intelligence data for the Health & Household category. This is quite a broad category on Amazon.com, covering products in subcategories like Vitamins, Minerals & Supplements and Diets & Sports Nutrition, but also things like Household Supplies or Baby & Child Care.
Not only is Health & Household a broad category, it is also one of the largest on Amazon.com, with the top 10 Health & Household brands generating more than three times the revenue in Q4 2022 than the equivalent top 10 in Patio, Lawn & Garden.
Who are the top 10 Health & Household brands by sales volume?
The top 10 list for Health & Household shows that there are four front-runners in the category, two of whom make Oral Care products. The other brands represent a mixture of subcategories, including Household Supplies (Amazon Basics, Tide, Energizer), Vitamins, Minerals & Supplements (Garden of Life, NOW, Optimum Nutrition), and Diet & Sports Nutrition (Liquid I.V.). Overall, the top 10 is a slightly tighter bunch than in Patio, Lawn & Garden, chiefly because the top brands have less of a lead over the rest.
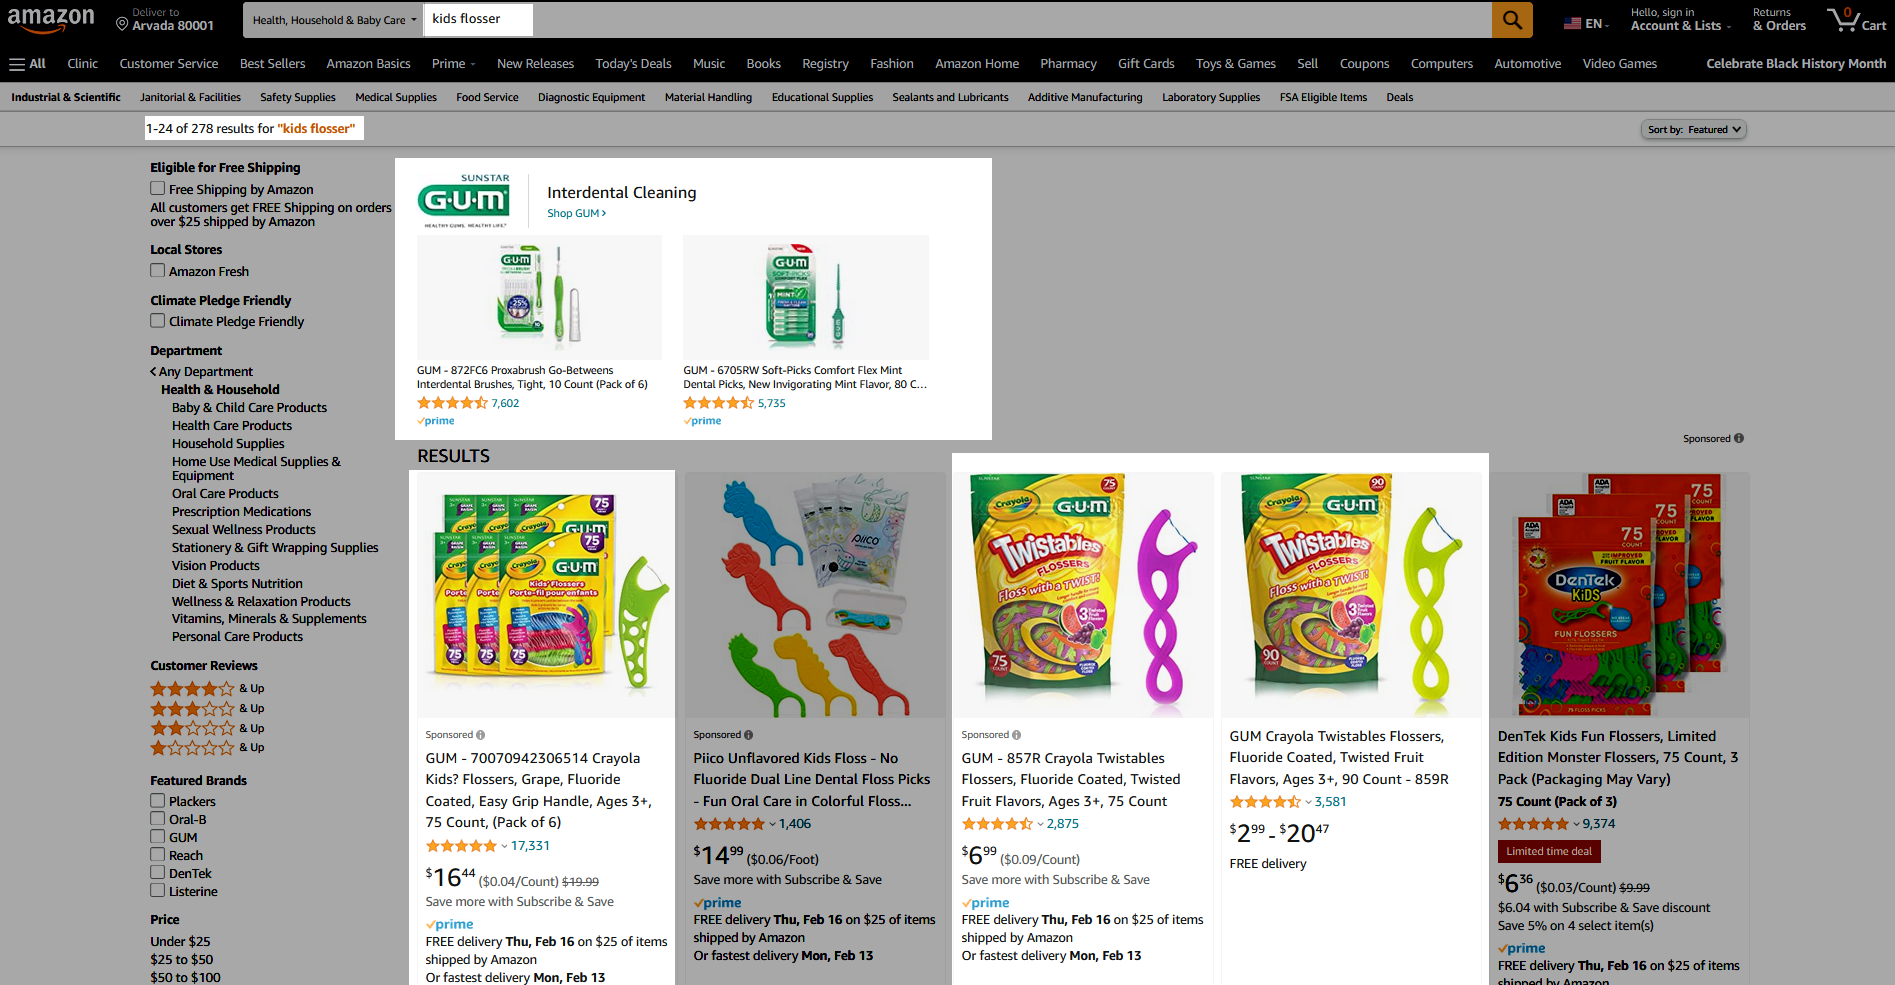
Key takeaway: When conducting market sizing and evaluating the top-performing brands in your category, don't just look at their Amazon sales volume. Dive deeper to understand what they are doing to generate this revenue. It is likely they are occupying Sponsored Brands and top-of-search Sponsored Products placements for high-volume (short-head) category keywords. Search on Amazon.com for toothbrush, electric toothbrush or flosser and you will more than likely see Oral-B, Philips Sonicare and Waterpik ads.
So how can you compete with brands of this size? The answer is in your strategy. If your market contains some behemoths, there's still room for your brand if you focus on your speciality. GUM (9th largest Oral Care brand in our Q4 2022 dataset) do a great job of winning Sponsored Brands, highly-visible Sponsored Products, and top organic placements for keywords like kids floss, kids flosser or flavored flossers.
An intelligent strategy—ideally coupled with an automated software solution—can ensure you target and bid aggressively on the right keywords. This can keep your sales up and your ACOS down by leveraging your USPs and reaching those customers who are most likely to convert.
Which are the most important subcategories within Health & Household?
Given the diversity of the category as a whole, it is perhaps surprising that Health & Household sales are so narrowly spread. 96% of sales are covered by just six subcategories, with over 25% produced by Vitamins, Minerals & Supplements.
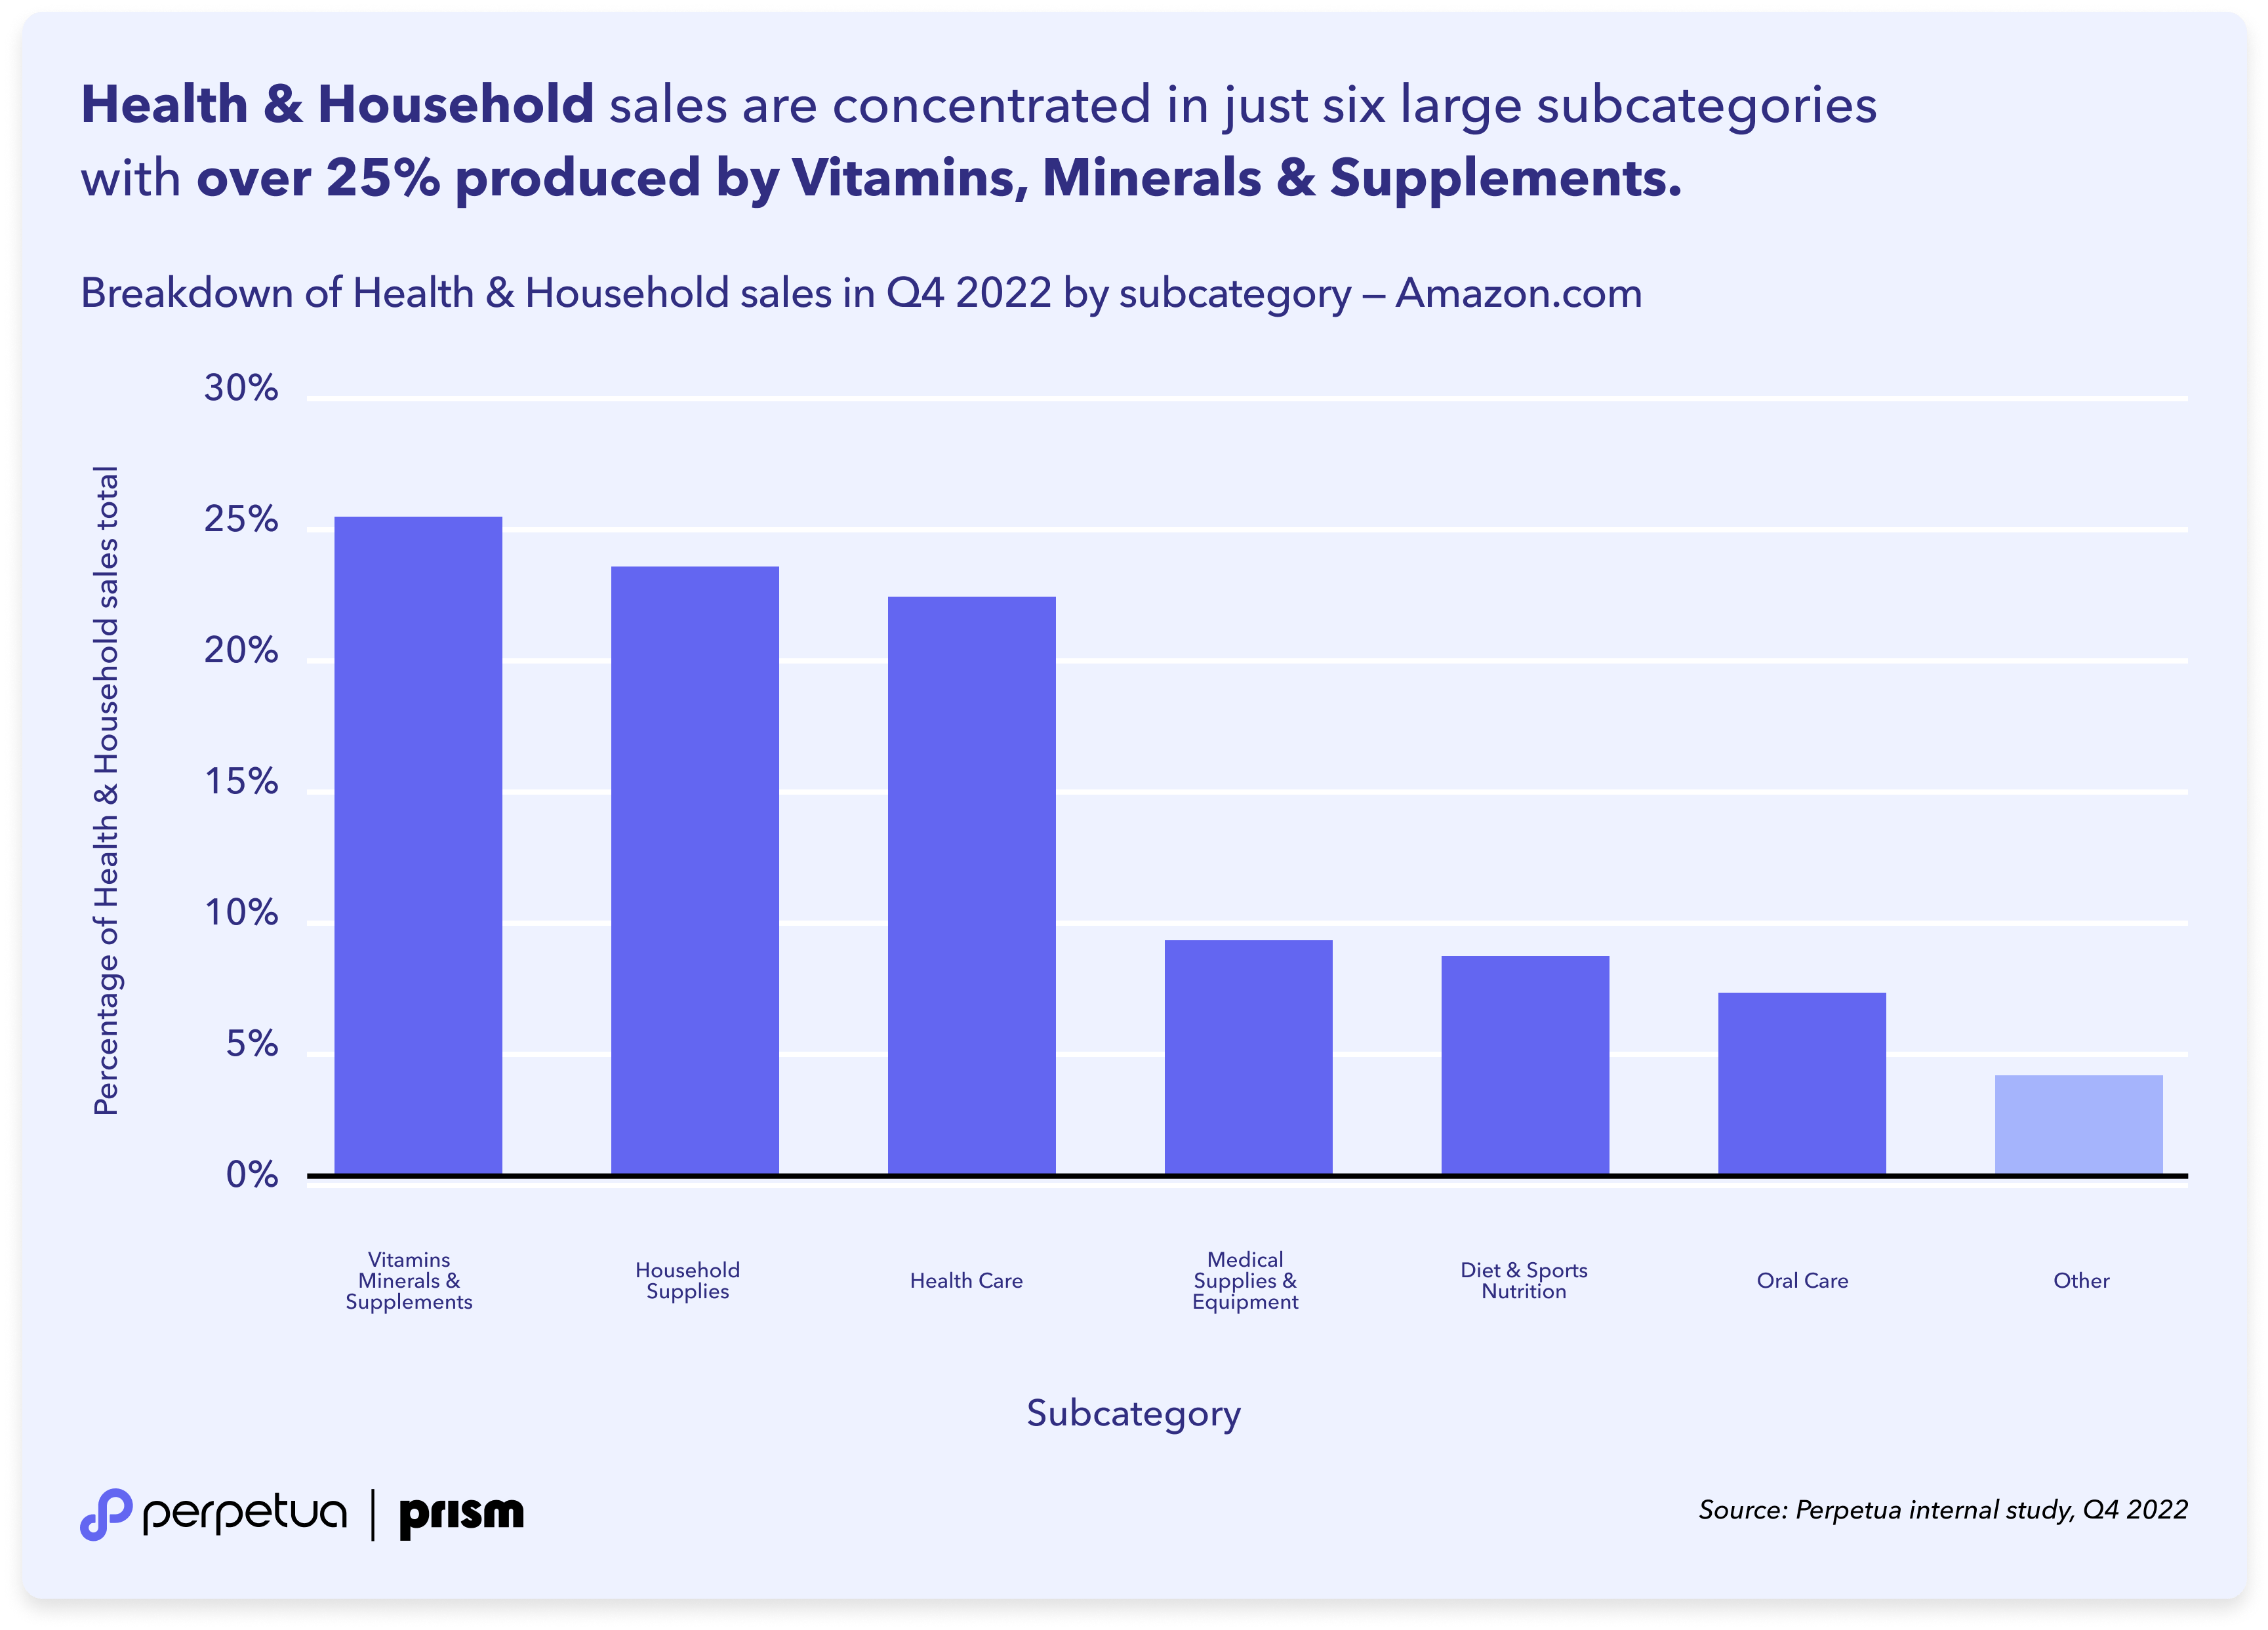
One point of interest is that Oral Care only makes up 7% of the category, even though it features several of the biggest Health & Household brands. This suggests that Oral Care is a category that skews towards a few highly-dominant brands. To investigate further, we can look at the top brands in the Oral Care category.
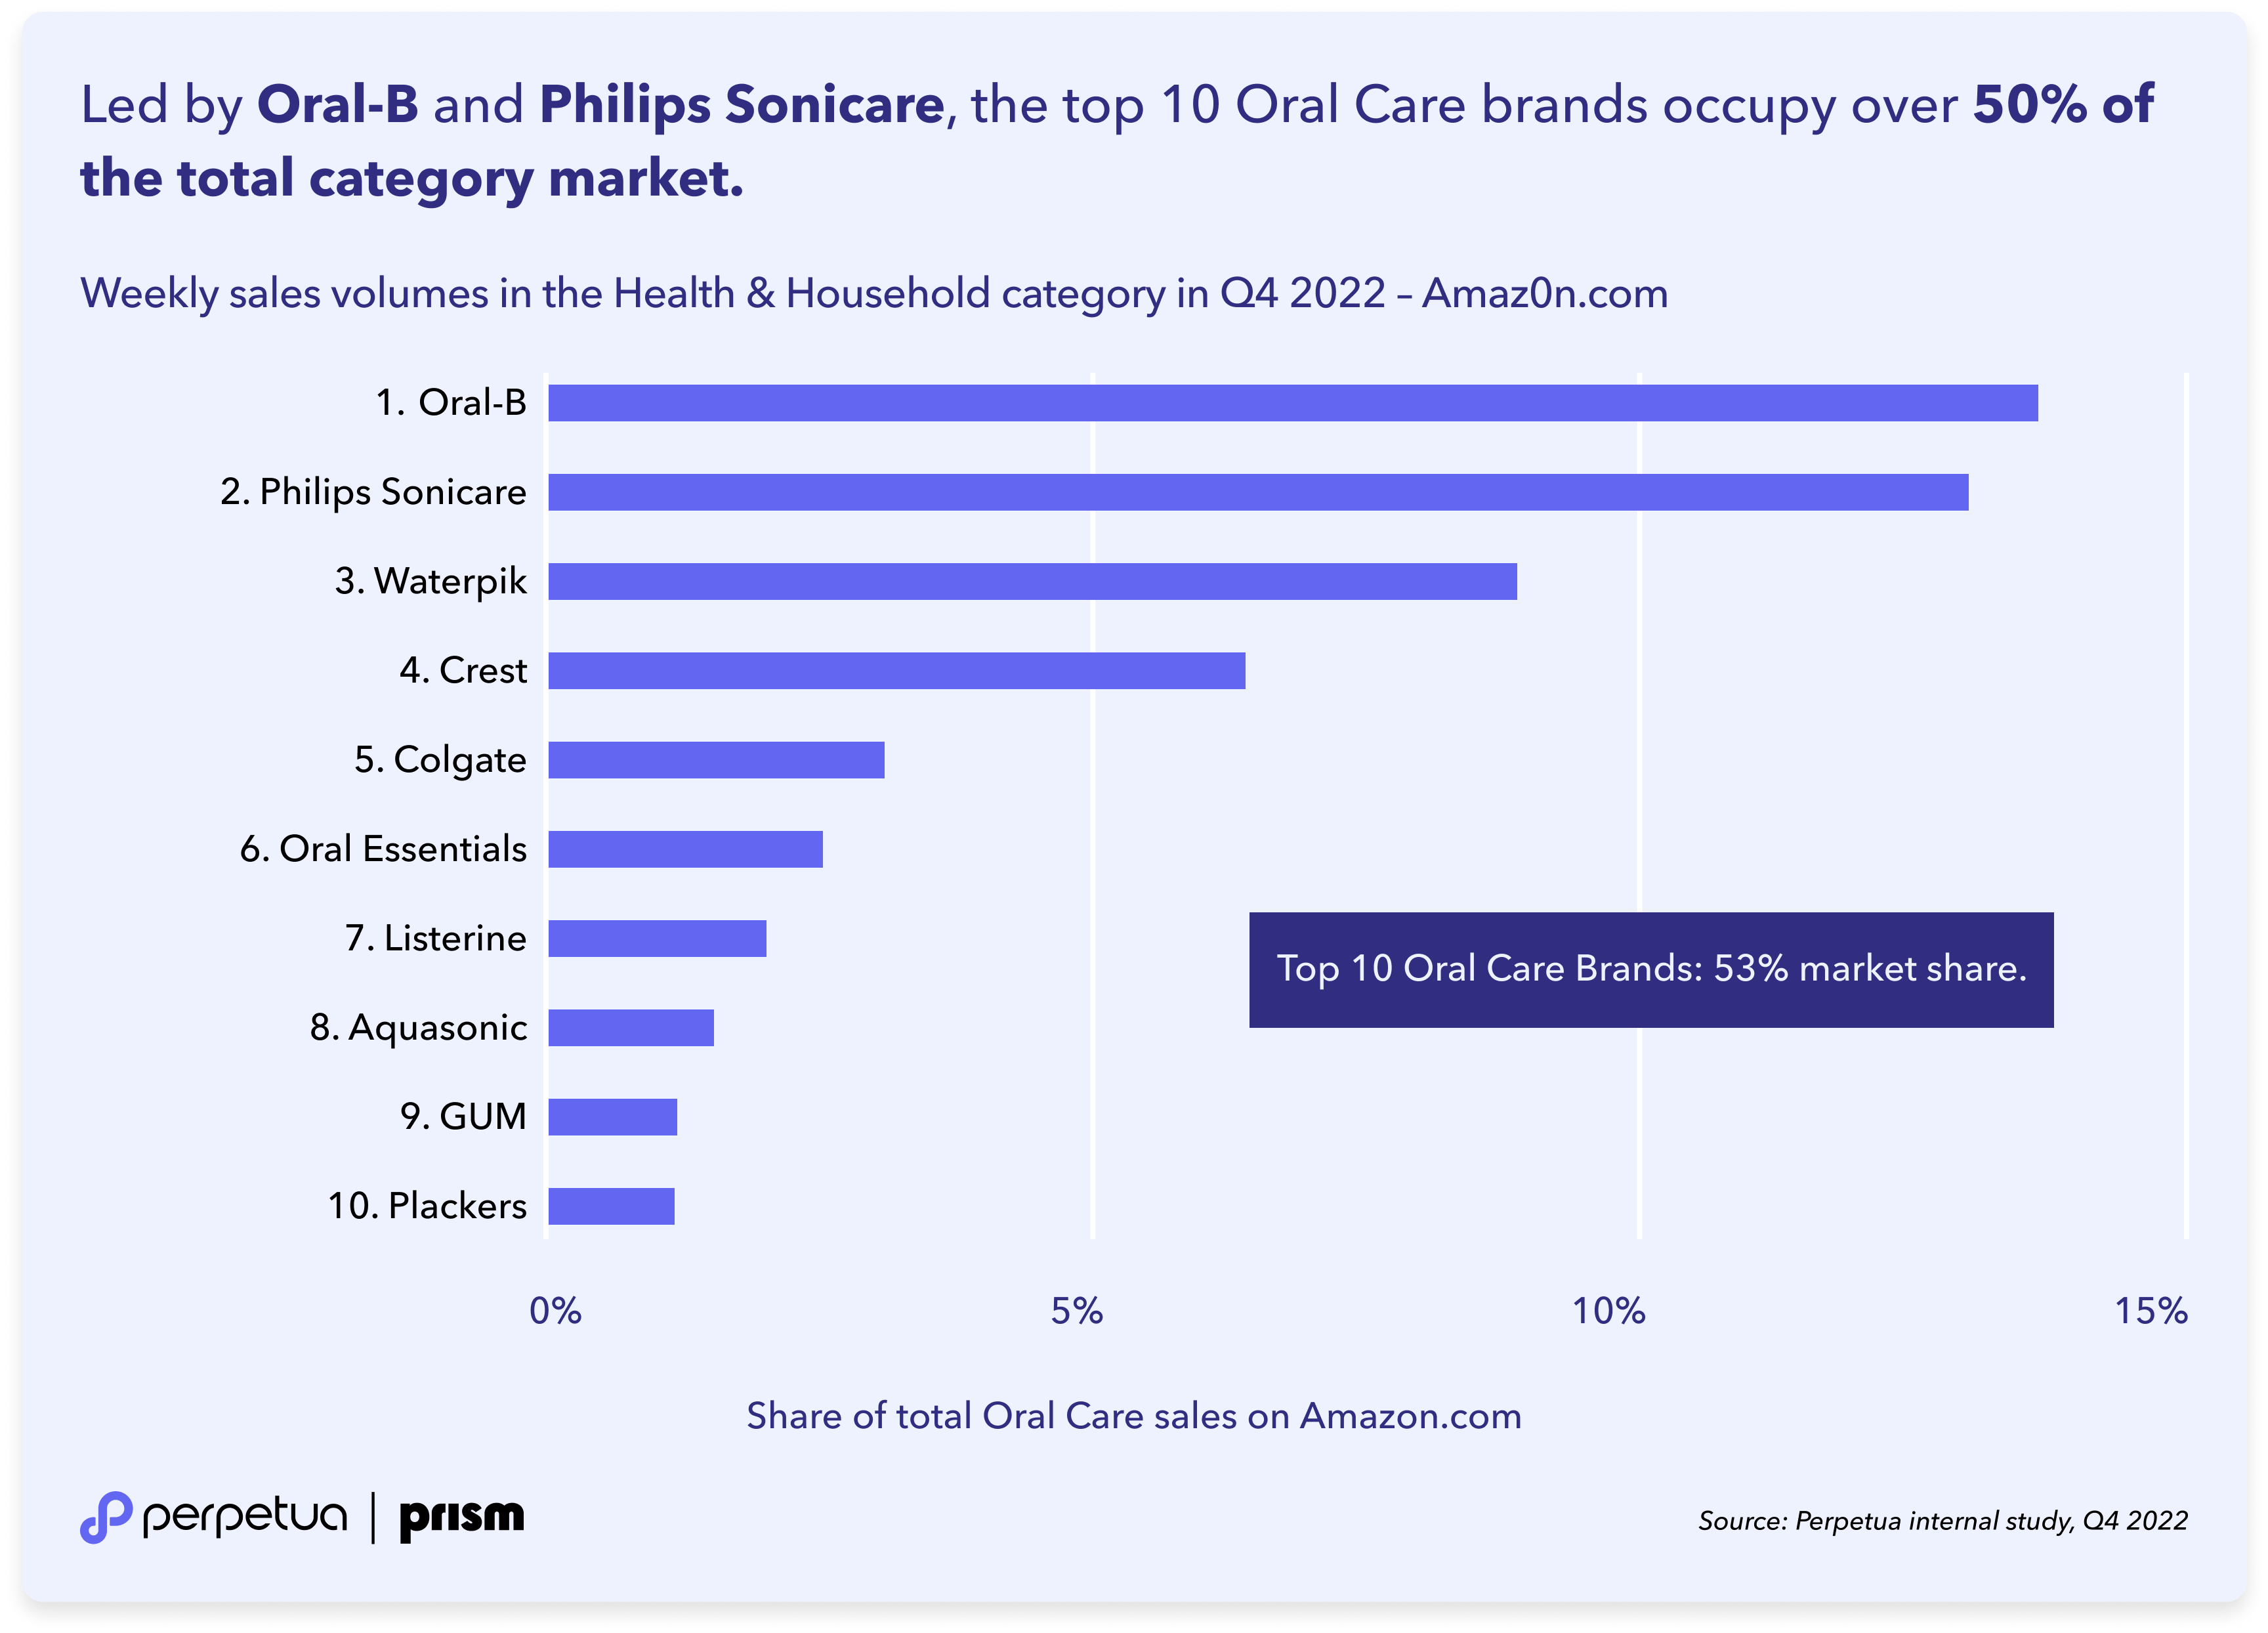
The chart confirms our initial hypothesis, as the top 10 brands generate 53% of sales—that's over half of the total market share in the Oral Care category.
For context on this 53% figure, we can look at the same data for the largest subcategory, Vitamins, Minerals & Supplements.
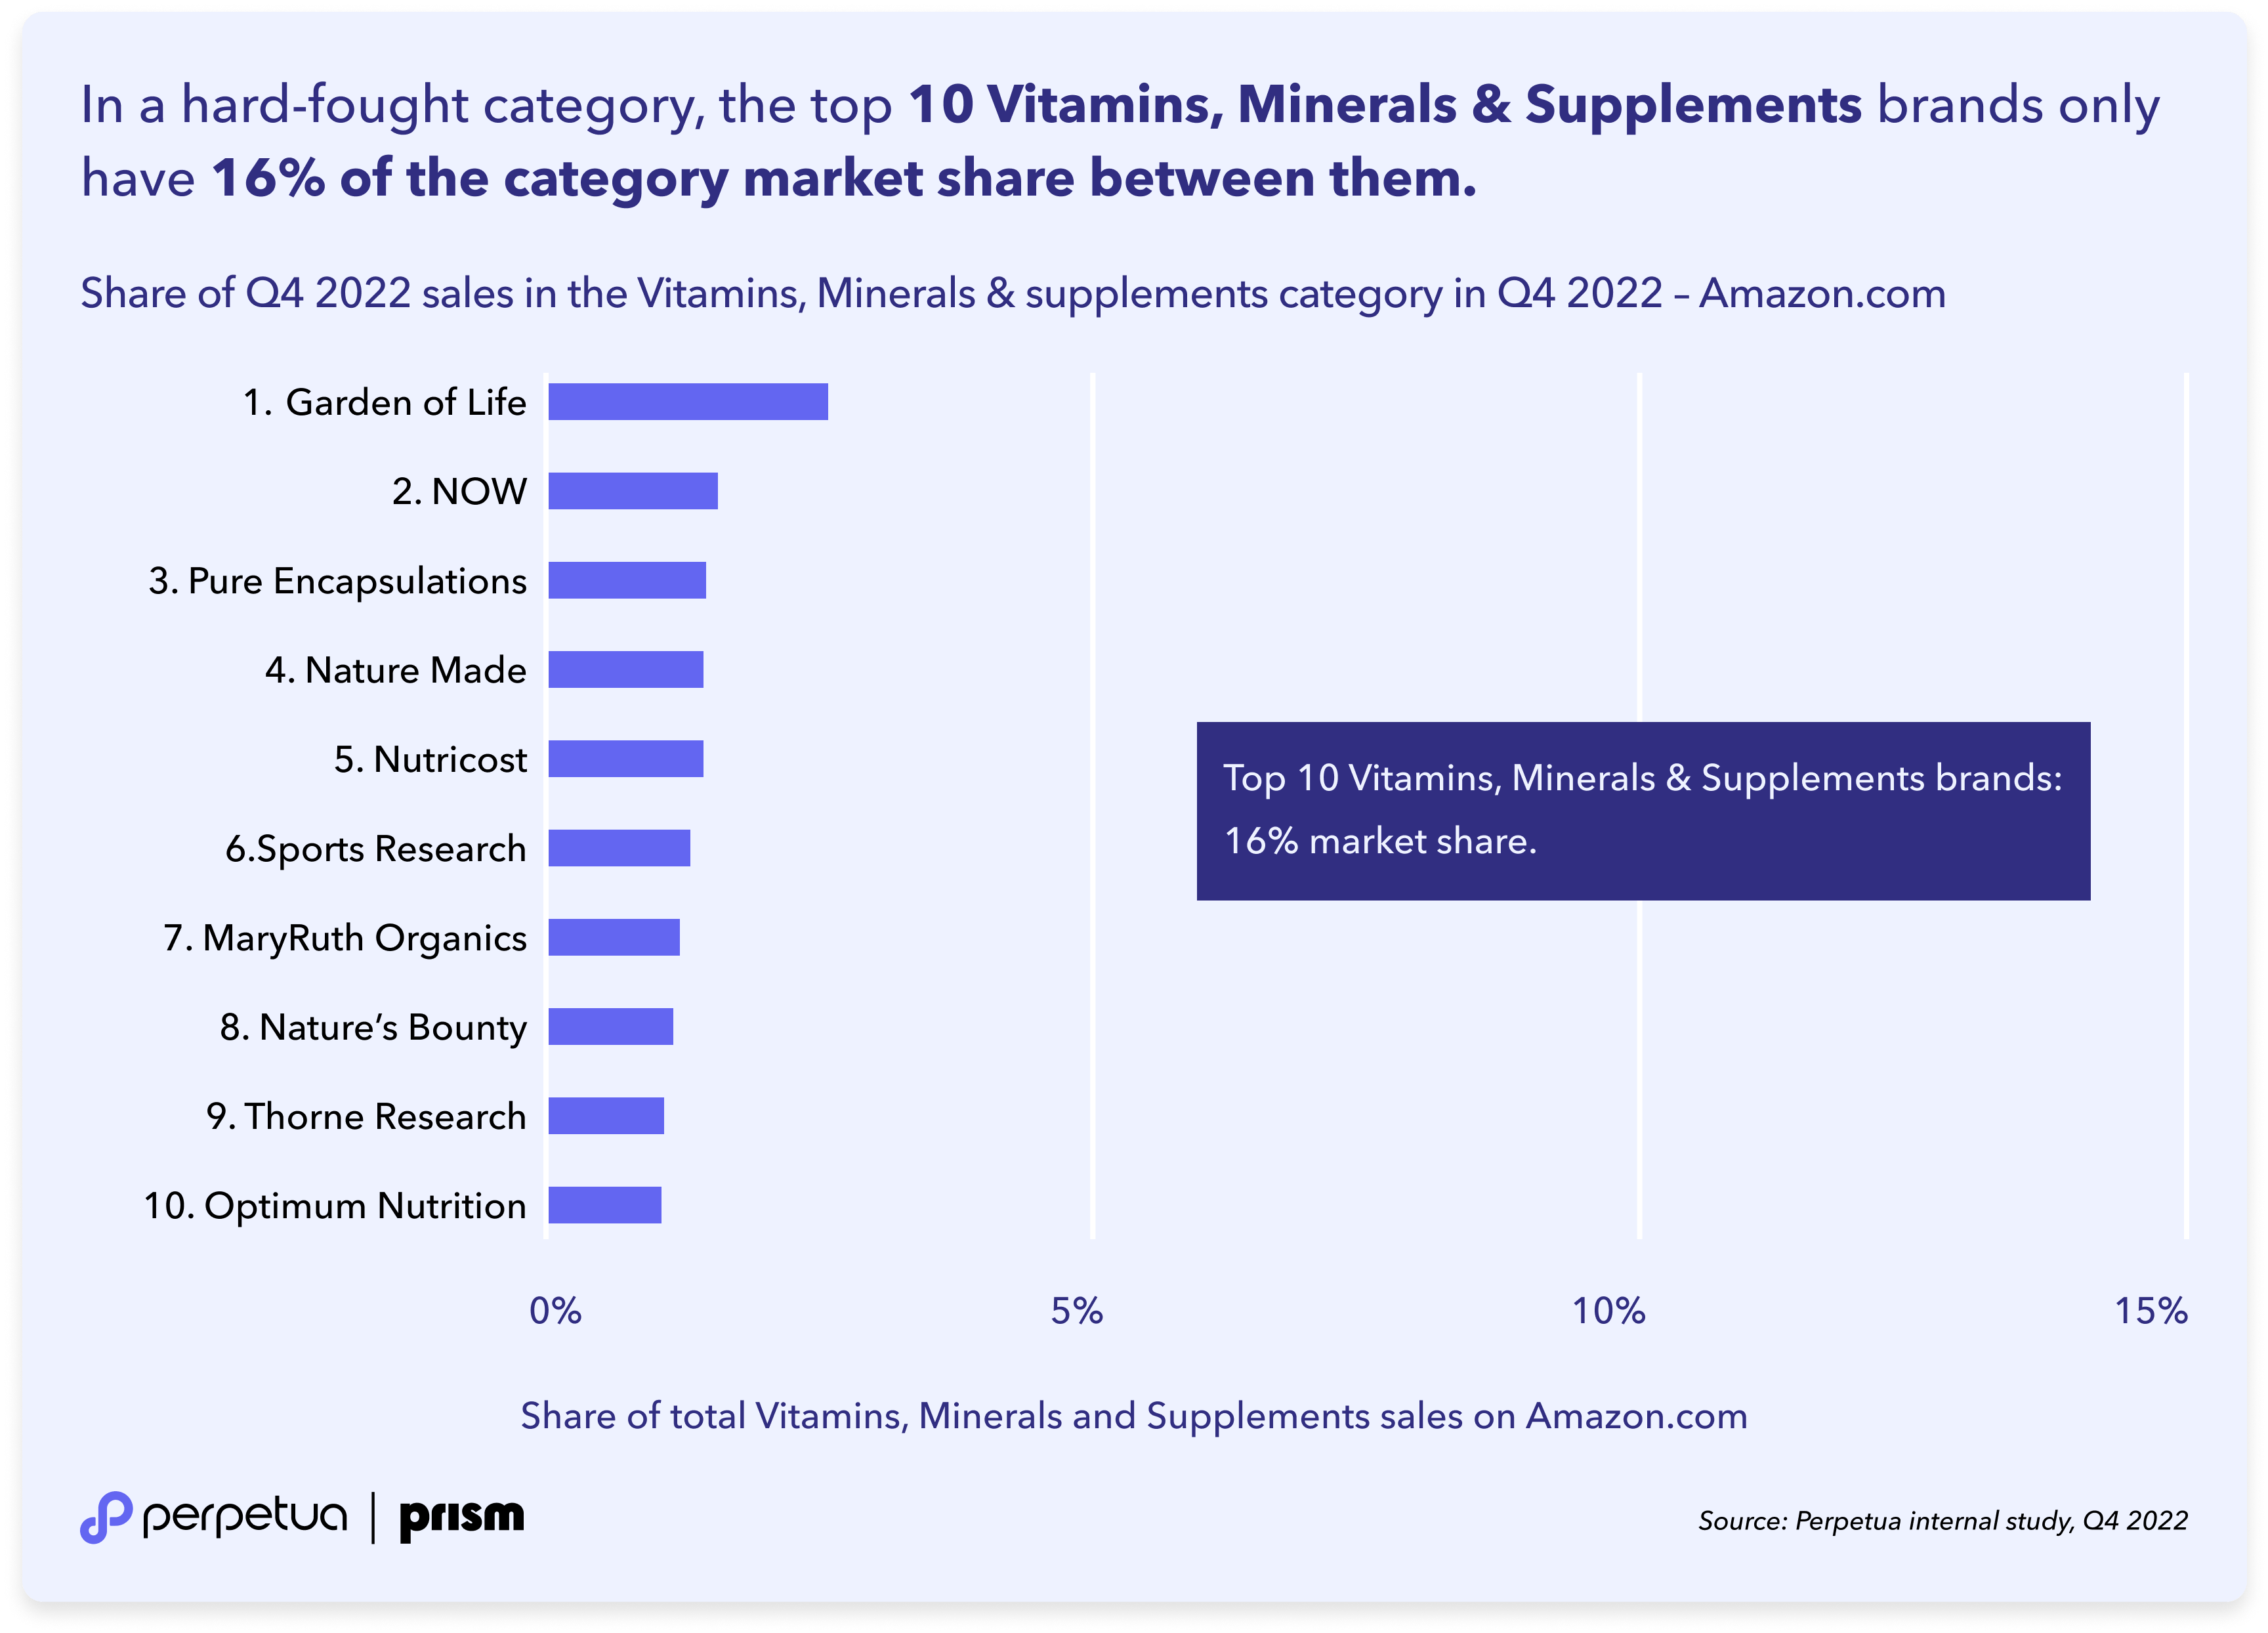
Here, we see that the top 10 Vitamins, Minerals & Supplements brands have a combined market share of just 16%. Even the market leader, Garden of Life, has less than 3%.
Key takeaway: Not every segment has the same dynamics. In a category like Vitamins, Minerals & Supplements, where almost nothing separates the top 10, there is huge potential for challenger brands to move up the field. One way is by increasing investment in Sponsored Brands and Amazon DSP ads that let you position your brand repeatedly and consistently in front of customers higher up the funnel. Back this up with the right product—and leverage customer loyalty opportunities like Amazon Subscribe & Save—and you could quickly become one of the brands to beat in your space.
How are sales distributed in different subcategories?
In our previous section, we saw that the top 10 Oral Care brands had a 53% market share within their category, which is much larger than the 16% share enjoyed by the top 10 Vitamins, Minerals & Supplements brands. However, looking at 10 brands doesn't tell the whole story, so let's zoom out and assess the overall sales distribution.
To do this, the chart below shows the Lorenz curve for cumulative percentage sales against cumulative percentage of brands within each category. If you're not familiar with Lorenz curves, the basic premise is: the closer the curve is to the 45° Line of Equality, the more evenly distributed the market. More space between the Line of Equality and the curve means that more sales are concentrated amongst a smaller number of brands.
Note that we have only included brands with at least $1,000 in weekly average sales to avoid a large number of new or micro-brands distilling the dataset.
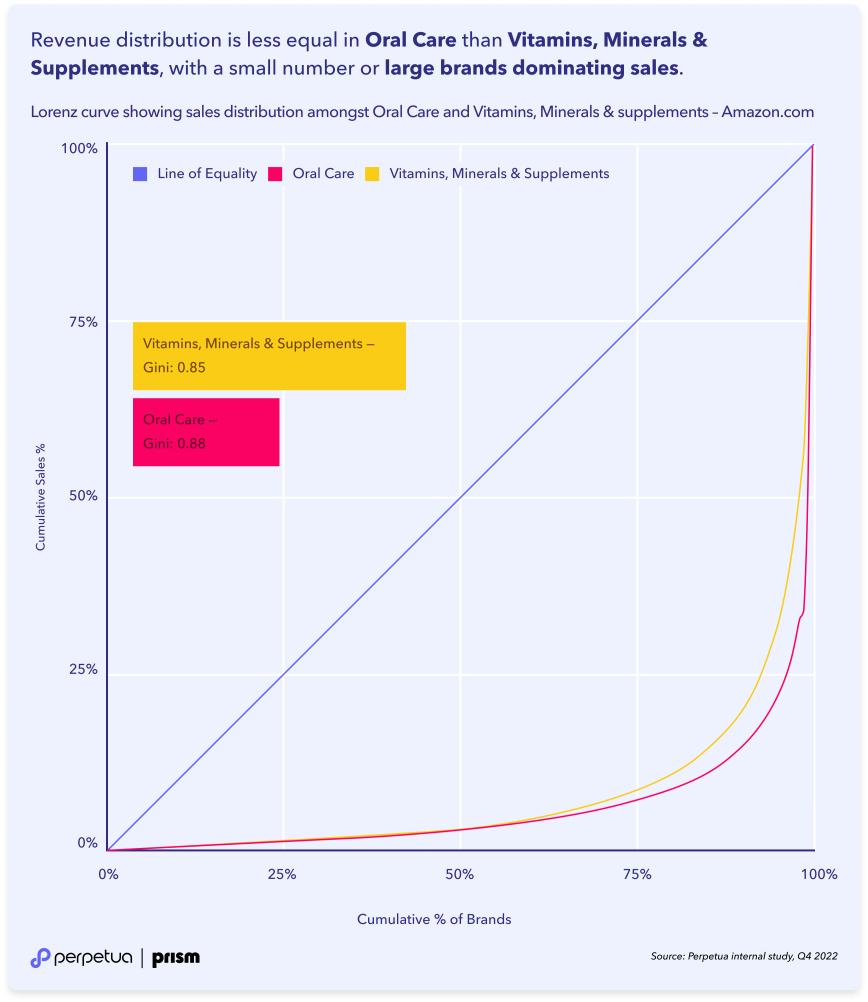
For Oral Care, we see that the Lorenz Curve is tighter to the x axis—and therefore further from the Line of Equality—than for Vitamins, Minerals & Supplements. This is reinforced by a Gini coefficient of 0.88, emphasizing the strength of a small number of dominant brands. If you're a mid-sized Oral Care brand, you've got a challenge ahead of you to break into the upper echelons of an extremely top-heavy market.
Key takeaway: Analyze your category or segment to see how revenue is distributed between brands and bring added nuance to your market awareness. If you're a mid-market brand investing in growth, then the size of the giants is of less importance than your other mid-market competitors. Seeing how comparable brands are succeeding will help you assess the realistic potential of your business in its current (or next) growth phase, and align your investment, recruiting and portfolio expansion plans accordingly.
One factor in success, as we saw above, is targeted advertising. In a category like Oral Care, there is room for specialist brands like GUM to be successful if they have a focused advertising strategy that plays to their products' strengths.
Diving deeper and understanding your niche
The dense concentration of sales in a few subcategories of Health & Household suggests that further insights could be gained by looking within the subcategories at the next level. To show how this works, let's look at the subcategory breakdowns for Vitamins, Minerals & Supplements and Oral Care.
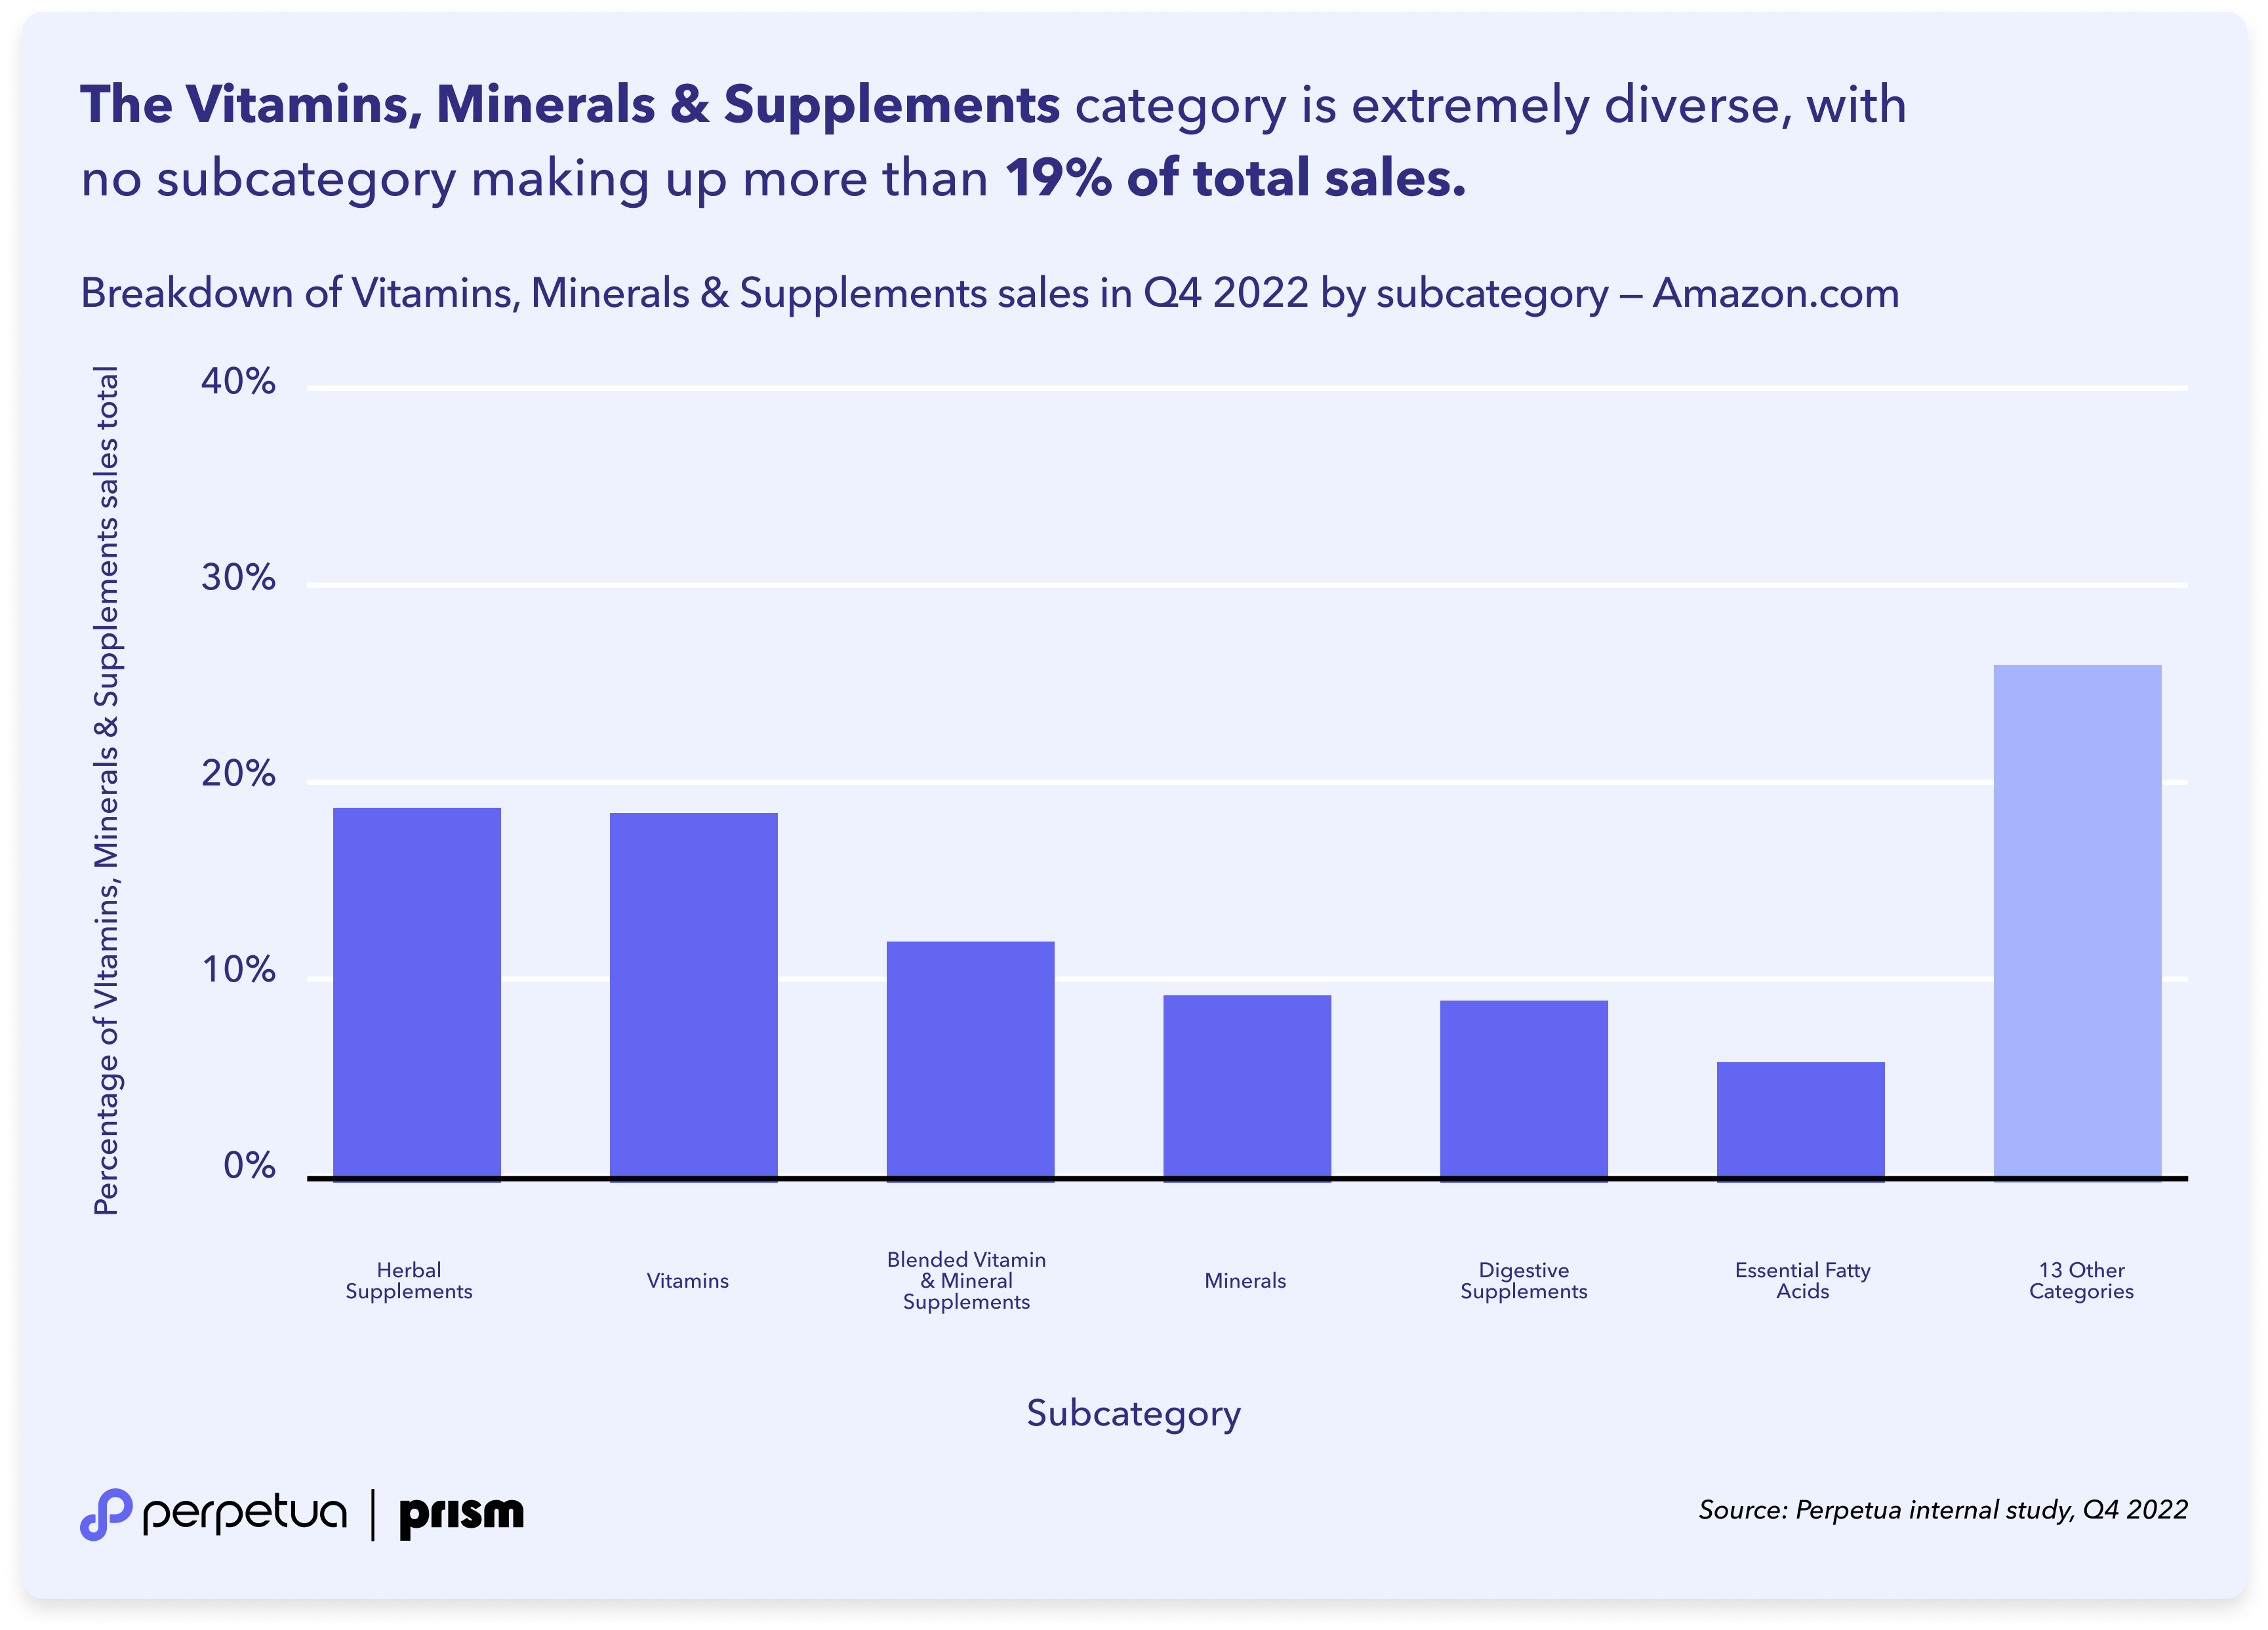
This shows that there are several subcategories of significant size even within Vitamins, Minerals and Supplements. For some companies, the whole category may be relevant, but for those with a more narrow range of products or who are focused on a highly specialized niche, it may be most useful to conduct an analysis that focuses on one subcategory, such as Digestive Supplements. Let's see how this compares to Oral Care.
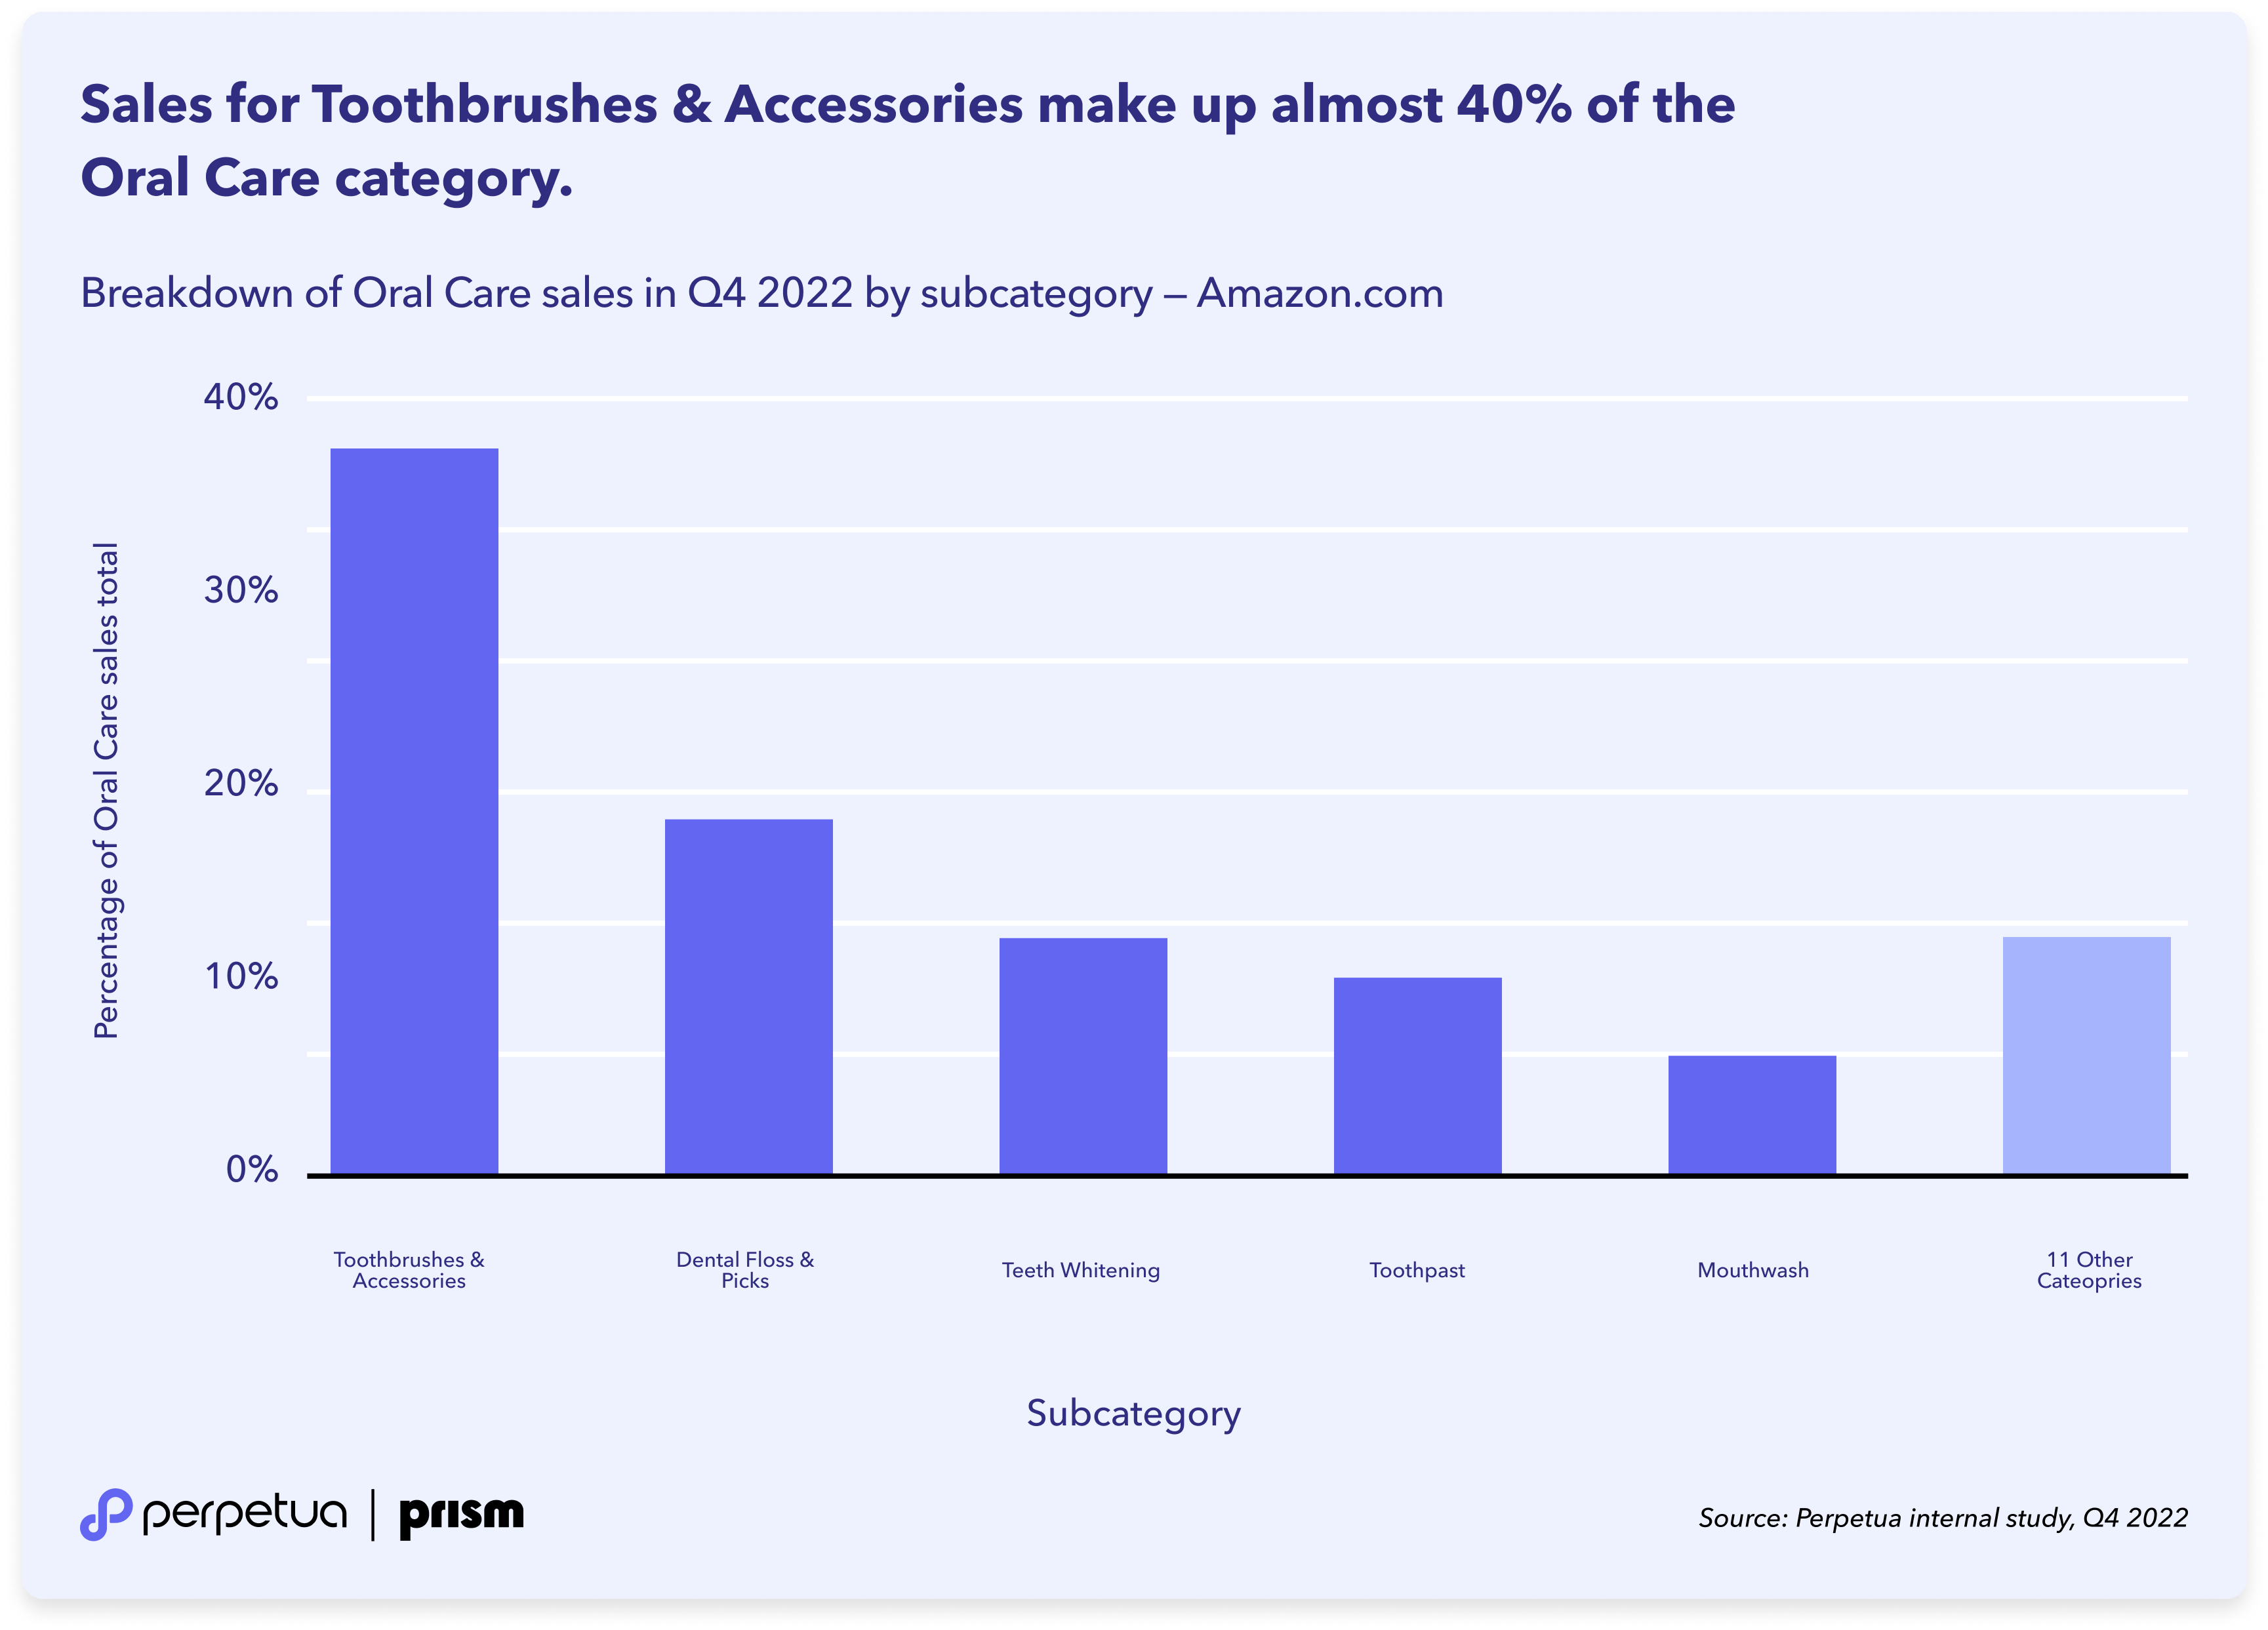
Here we have one subcategory, Toothbrushes & Accessories, in which almost two fifths of sales are generated. This is where Oral-B and Philips Sonicare, two of the leading Health & Household brands, generate most of their sales.
Take action: If you are running successful ads in your specialist segment, but want to expand, consider the audience overlap across related categories. Pick an adjacent category and experiment with Sponsored Brands or Sponsored Display ads on high-volume keywords and high-performing ASINs. This can help you reach potential customers who are interested in complementary products and who are likely to add your products to their shopping carts. An Ad Engine like Perpetua's can quickly identify the best product matches and optimize the targeting to ensure you reach your sales goals.
What are the best-selling Health & Household ASINs?
The table shows the 20 ASINs in the Health & Household category with the highest volume of sales during Q4 2022.
Rank | ASIN | Brand | Title | Subcategory |
|---|---|---|---|---|
1 | Bloom Nutrition | Bloom Nutrition Green Superfoo ... | Vitamins, Minerals & Supplements | |
2 | Premier Protein | Premier Protein Shake, Vanilla ... | Diet & Sports Nutrition | |
3 | Philips Sonicare | Philips Sonicare 4100 Electric ... | Oral Care | |
4 | 23andMe | 23andMe Health + Ancestry Serv ... | Medical Supplies & Equipment | |
5 | Waterpik | Waterpik Aquarius Water Flosse ... | Oral Care | |
6 | Better Body Co. | Better Body Co. Original Provi ... | Health Care | |
7 | Waterpik | Waterpik Cordless Advanced Wat ... | Oral Care | |
8 | Vital Proteins | Vital Proteins Collagen Peptid ... | Vitamins, Minerals & Supplements | |
9 | Optimum Nutrition | Optimum Nutrition Micronized C ... | Vitamins, Minerals & Supplements | |
10 | Goli | Goli Apple Cider Vinegar Gummy ... | Diet & Sports Nutrition | |
11 | Liquid I.V. | Liquid I.V. Hydration Multipli ... | Diet & Sports Nutrition | |
12 | Amazon Basics | Amazon Basics 10 Pack AA Alkal ... | Household Supplies | |
13 | Cloud Massage | Cloud Massage Shiatsu Foot Mas ... | Wellness & Relaxation | |
14 | Philips Sonicare | Philips Sonicare ProtectiveCle ... | Oral Care | |
15 | Crest | Crest 3D Whitestrips, Professi ... | Oral Care | |
16 | Dymatize | Dymatize ISO 100 Whey Protein ... | Diet & Sports Nutrition | |
17 | AncestryDNA | AncestryDNA + Traits: Genetic ... | Medical Supplies & Equipment | |
18 | Tide | Tide Pods + Bounce Pet Dryer S ... | Household Supplies | |
19 | Presto! | Amazon Brand - Presto! 308-She ... | Household Supplies | |
20 | Tide | Hypoallergenic Bundle: Tide PO ... | Household Supplies |
Bloom Nutrition, just 44th in the list of top Health & Household brands, had the bestselling ASIN in the category in Q4 2022. Bloom Nutrition's best-selling Herbal Supplement was responsible for 95% of its Q4 sales, and is perfect evidence for the potential of a single ASIN.
The top brand overall, Oral-B, is surprisingly absent from the list of top 20 ASINs. There are, however, three Oral-B ASINs in the top 100, and a further 20 in the top 1,000, which underlines the strength of the Oral-B brand. This isn't a company with one single hero product, but a wide portfolio, all of which benefits from Oral-B's excellent brand recognition and reputation.
Take action: If you're not Oral-B, and most businesses aren't, then pushing a hero product can be a great way to drive your brand and pull up your whole Amazon portfolio. If you're missing such a product, then study the list of bestselling ASINs and look for opportunities, like a similar product to yours that demonstrates demand exists.
If you spot a similar product amongst the top ASINs, then ask yourself why your product isn't performing in the same way. It's possible that you simply haven't given it the ad spend backing it needs to maximize its potential, but you can also look into the content and images on your product detail page, review management, and other listing optimization strategies that will increase conversion rates and drive sales.
Health & Household: the power of brand
Oral-B's success, despite not having a single ASIN in the top 20 of the category, is a textbook example of the power of brand for generating sales on Amazon. Sponsored Products ads remain the centerpiece of a successful advertising strategy, but Amazon now offers more opportunities than ever to invest in brand-building activities that help you win new customers, strengthen your relationship with existing customers, and steal sales from your competitors.
Three key ways of strengthening your brand presence on Amazon are:
Using top-of-search multipliers for Sponsored Products ads can ensure you secure the most prominent placements—a stronger ad presence can also provide a keyword boost for your organic listings and increase your visibility there.
Attractive Sponsored Brands ads, in particular Sponsored Brands Video ads, make you stand out at the top of the Amazon search results page, and let you link to a brand store page where you can showcase your products. This helps you get not just top-of-search, but also top-of-mind with your target audience.
The Amazon DSP provides a wealth of opportunities for upper-funnel activities, including OTT ads on streaming services. A key advantage of the Amazon DSP is it allows for precision targeting based on a vast range of criteria. It can be complex, but the payoff can be incredible.
In most cases, utilizing a combination of these strategies will have the biggest impact. If you want to find out more about the synergy effects of the Amazon DSP and the boost it can give your Sponsored Products ads, check out our Amazon DSP deep-dive.
Conclusion: this is only the beginning for Prism
While some of the main takeaways are listed in the Executive Summary at the top of this article, the main conclusion is that this kind of market and competitive intelligence data provides a gateway to incredibly powerful insights.
This Prism study has only looked at two of Amazon.com's top-level categories, with a few excursions into lower-level detail. Yet we were still able to analyze a brand's competition, use market data to understand the dynamic between larger and smaller brands, and reveal stark differences in brands' portfolios.
An article of this kind could never aim to offer an exhaustive analysis, even of the categories chosen here. This data is new. And we're only starting out. So while we've highlighted some interesting perspectives, we're most excited about the future, and seeing how you—as market-aware advertisers—will use Prism data to further your understanding and power your own innovative eCommerce initiatives.
Want to do your own analysis?
You can sign up today for a Prism demo and get first-hand experience of how to leverage the power of market-aware advertising.
Annex
Here we provide more details on the study data and methodology, and a glossary of terms that explains their usage in this article.
Data and Methodology
The findings presented in this study are based on Perpetua's proprietary database that underpins our new market and competitive intelligence software, Prism. A key feature of Prism is how it provides new data every week, allowing users to track market developments and analyze the latest performance trends of competing brands. This study is based on 13 weeks of data covering Q4 2022.
A few key points to note:
All data is from Amazon.com's US marketplace;
If not otherwise stated, metrics are given as weekly averages (e.g., units sold per week)
Sales volumes are given as indexed values to avoid disclosing business revenue figures—the focus of the study is a neutral assessment of market structures
Where the term "brand" is used, this refers to the brand of the ASIN as indicated in the Amazon product listing, and not to the seller or vendor;
Any values given for ASINs are totals for a parent ASIN and any children;
Perpetua's Prism data—most notably units sold and sales volumes—is not restricted to attributed ad conversions and sales, but refers to an ASIN's total sales and conversions;
Categorization is conducted at the ASIN level, meaning that a brand's products can appear in multiple categories;
Categorization is in line with Amazon.com's product taxonomy.
For more details on terminology or metrics, please refer to the glossary below.
Glossary
The table provides short explanations of some of the terms used in this article.
Term | Explanation | Example |
|---|---|---|
Average weekly sales volume (indexed) | The total sales volume of all of a brand's ASINs in the reference category, divided by the number of weeks. Given as index values to avoid disclosure of business revenue figures. | 1.2 |
Bestselling ASINs | The term 'bestselling' is used to describe ASINs that generate the most sales volume, calculated as units sold multiplied by average selling price. | - |
Category | Based on Amazon's taxonomy, a category groups together products based on thematic similarity. Categories are structured in a hierarchy, with parent categories encapsulating products that belong to their subcategories. | Health & Household, Patio, Lawn & Garden |
Gini coefficient | A metric used to express inequality within a group. Used in this article to describe how evenly or unevenly sales volume is distributed in a given category. Range from 0 (total equality) to 1 (total inequality). See also: Gini coefficient
| 0.85 |
Lorenz curve | A graphical visualization of the distribution of equality in a population. Used in this article to show how evenly sales volume is distributed amongst brands in a given category. See also Lorenz Curve. | |
Market Share | The proportion of sales a brand has within a defined market, which could be a custom-built market or, for example, all the ASINs within a particular category or subcategory. Usually expressed as a percentage, with all brands' market shares summing to 100%. | 5.4% |
Subcategory | Used to describe a category in reference to its parent category. A subcategory is a category that is contained completely with a parent category, but that does not represent the whole category. Subcategories can also contain further subcategories at lower levels of the hierarchy. | Vitamins, Minerals and Supplements, Gardening & Lawn Care |
To get started or learn more about how Perpetua can help you scale your Amazon Advertising business, contact us at hello@perpetua.io
Top Stories