
Impressions vs conversion rates: an analysis of Amazon Advertising benchmarks for Q2 2023
Stephen Bench-Capon, August 24, 2023
Our quarterly benchmark reports contain a wealth of industry data, with quarterly and annual trends, and metrics for all Amazon advertising formats. In this article, we pick out a few of the most interesting advertising benchmarks for Q2 2023 and take a deeper dive to analyze the trends, understand the relationship between metrics, evaluate the performance of different ad formats and—most importantly—explore what advertisers can learn about goal-setting, investing their budgets effectively, and taking control.
Amazon Sponsored Brands: still a worthwhile use of your upper-funnel ad budget?
One Amazon Advertising development that stands out when reviewing the metrics from Q2 2023 concerns Amazon Sponsored Brands. The last twelve months have seen click-through rates for Amazon Sponsored Brands ads fall significantly across Amazon's three North American marketplaces.
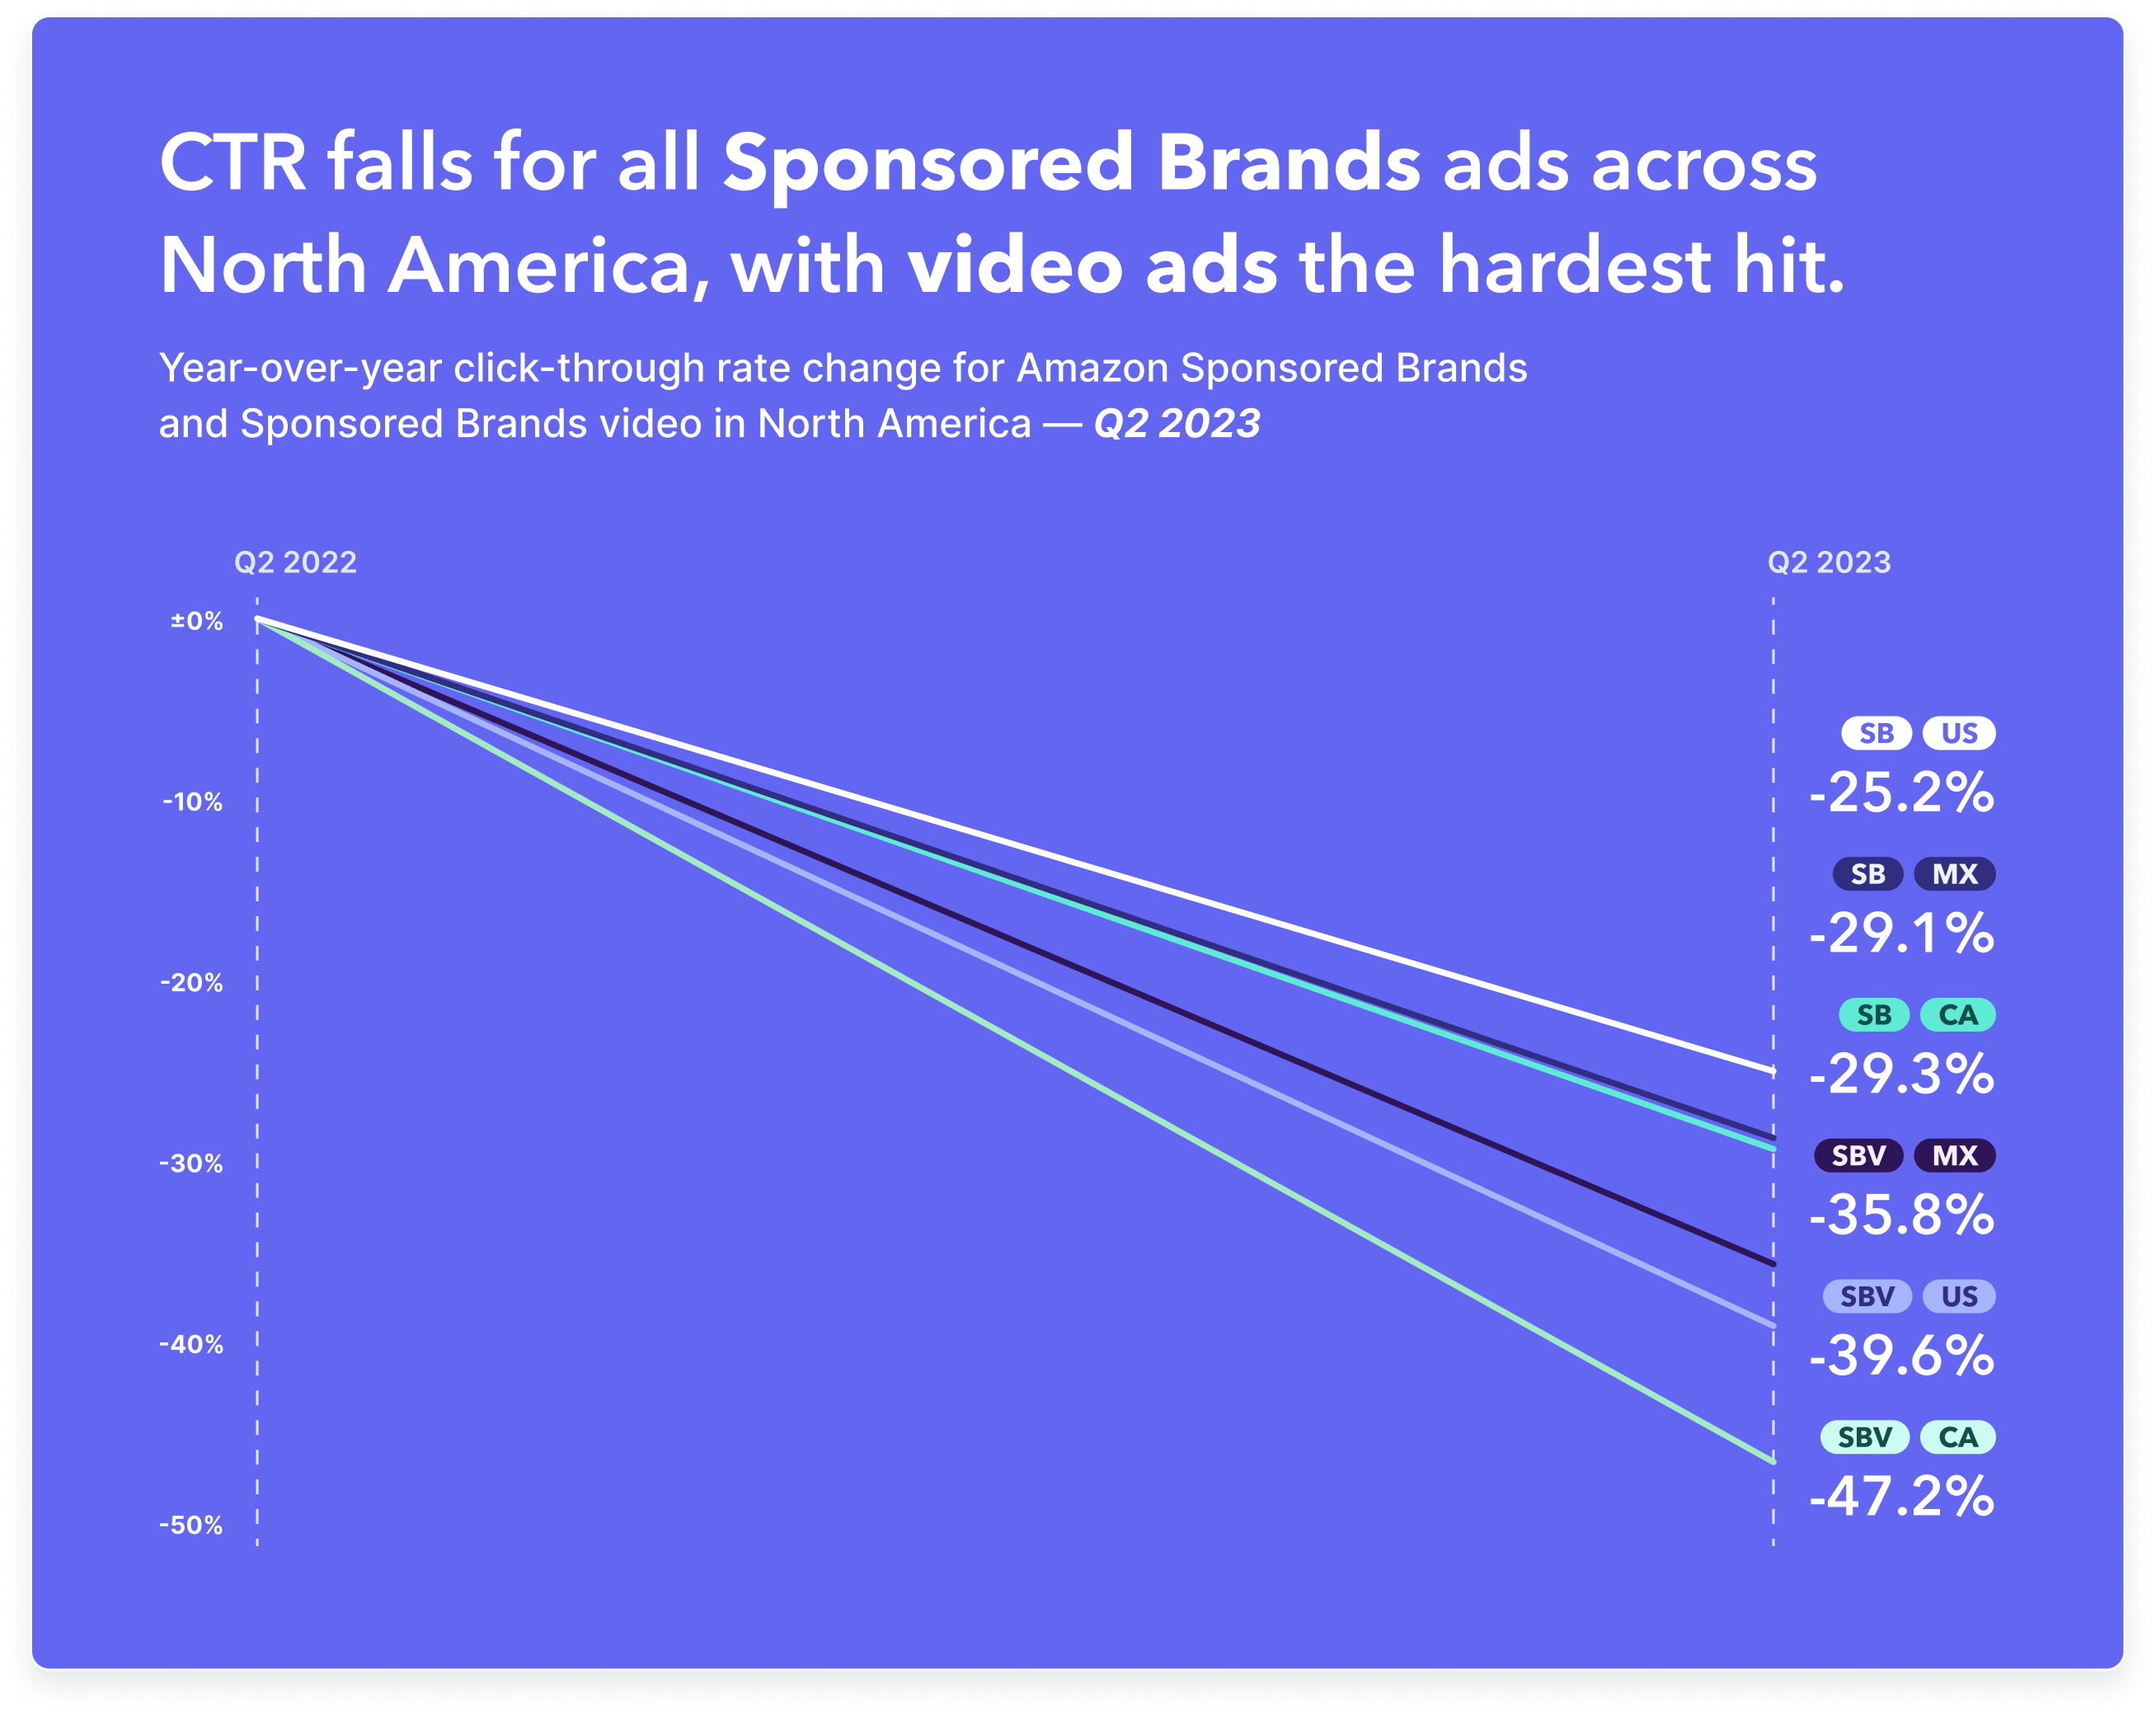
There is a striking pattern. In each of Mexico, Canada and the US, the CTR for Sponsored Brands video is down by more than for non-video ads, but even the best-performing format (non-video, US) has seen a 25.2% year-over-year drop.
What's driving down click-through rates for Amazon Sponsored Brands ads?
A decline in click-through rates, calculated as the number of impressions divided by the number of clicks, can be caused by any of the following:
impressions go up and clicks are steady or go down
impressions are steady and clicks go down
impressions and clicks both go up, but impressions go up by more
impressions and clicks both go down, but clicks go down by more
So which of these are we dealing with for Sponsored Brands ads? We can find out by looking at the development in impressions and clicks over the last 12 months:

The quarterly data reveals insights hidden by the year-over-year trend, including more differentiation between ad types:
The second half of 2022 saw an increase in impressions for both formats, with impressions for non-video ads almost doubling
Clicks also grew over the course of H2 2022 for both Sponsored Brands formats, but not by nearly as much. Even at their peak in Q4 2022, clicks were only 53% (or 28% for SBv) above their Q2 levels
A drop in volumes in Q1 is an expected seasonal development, though for Sponsored Brands in Q1 2023 this was so steep it saw clicks fall to (or below for SBv) their Q2 level
There was no click recovery, so the gap between impressions and click growth held in Q2 2023.
The tl;dr is that Amazon is displaying far more Sponsored Brands ads to consumers, but these ads aren't being clicked on at the same rate.
What is the impact of falling CTR for Sponsored Brands ads?
A falling CTR doesn't have to be a bad thing. The primary purpose of Sponsored Brands is often upper-funnel awareness, which means you want as many eyeballs on your brand and products as possible. And in pay-per-click (PPC) advertising models, eyeballs don't cost you a dime.
If you're running brand-building campaigns and brand share-of-voice is your primary success KPI, then low clicks might not be a major concern. However, if your Sponsored Brands CTRs are falling, then this could indicate that you're not targeting relevant shoppers, which means your brand-building might not be as valuable as you think.
One indicator that Amazon is aiming to improve the CTR of Sponsored Brands ads is the roll-out of multi-ASIN Sponsored Brands video. This lets advertisers showcase 3 ASINs within a single ad—and an Amazon study found that these ads saw a 43.9% higher CTR than those with a single ASIN.
How well am I performing?
To understand how successful your ads are, you need to know the benchmarks for your category and ad format. Read our latest Amazon Benchmark Report for North America to explore industry trends and compare your performance to see where you stand.
Conversion rate and sales benchmarks for Sponsored Brands ads
Even if increasing awareness is your main focus, your Amazon Sponsored Brands ads are still being seen by shoppers who, by the very fact that they are shopping on Amazon, have a comparatively high propensity to purchase.
An analogy could be the billboard ad by the highway that points to the burger restaurant at the next exit. For the majority of those driving by, this is pure brand awareness, but for a certain percentage, seeing that ad at that moment may speak to an acute need and result in an immediate purchase.
So while the falling click-through rates suggested a certain level of saturation for Sponsored Brands ads, how are conversions holding up?
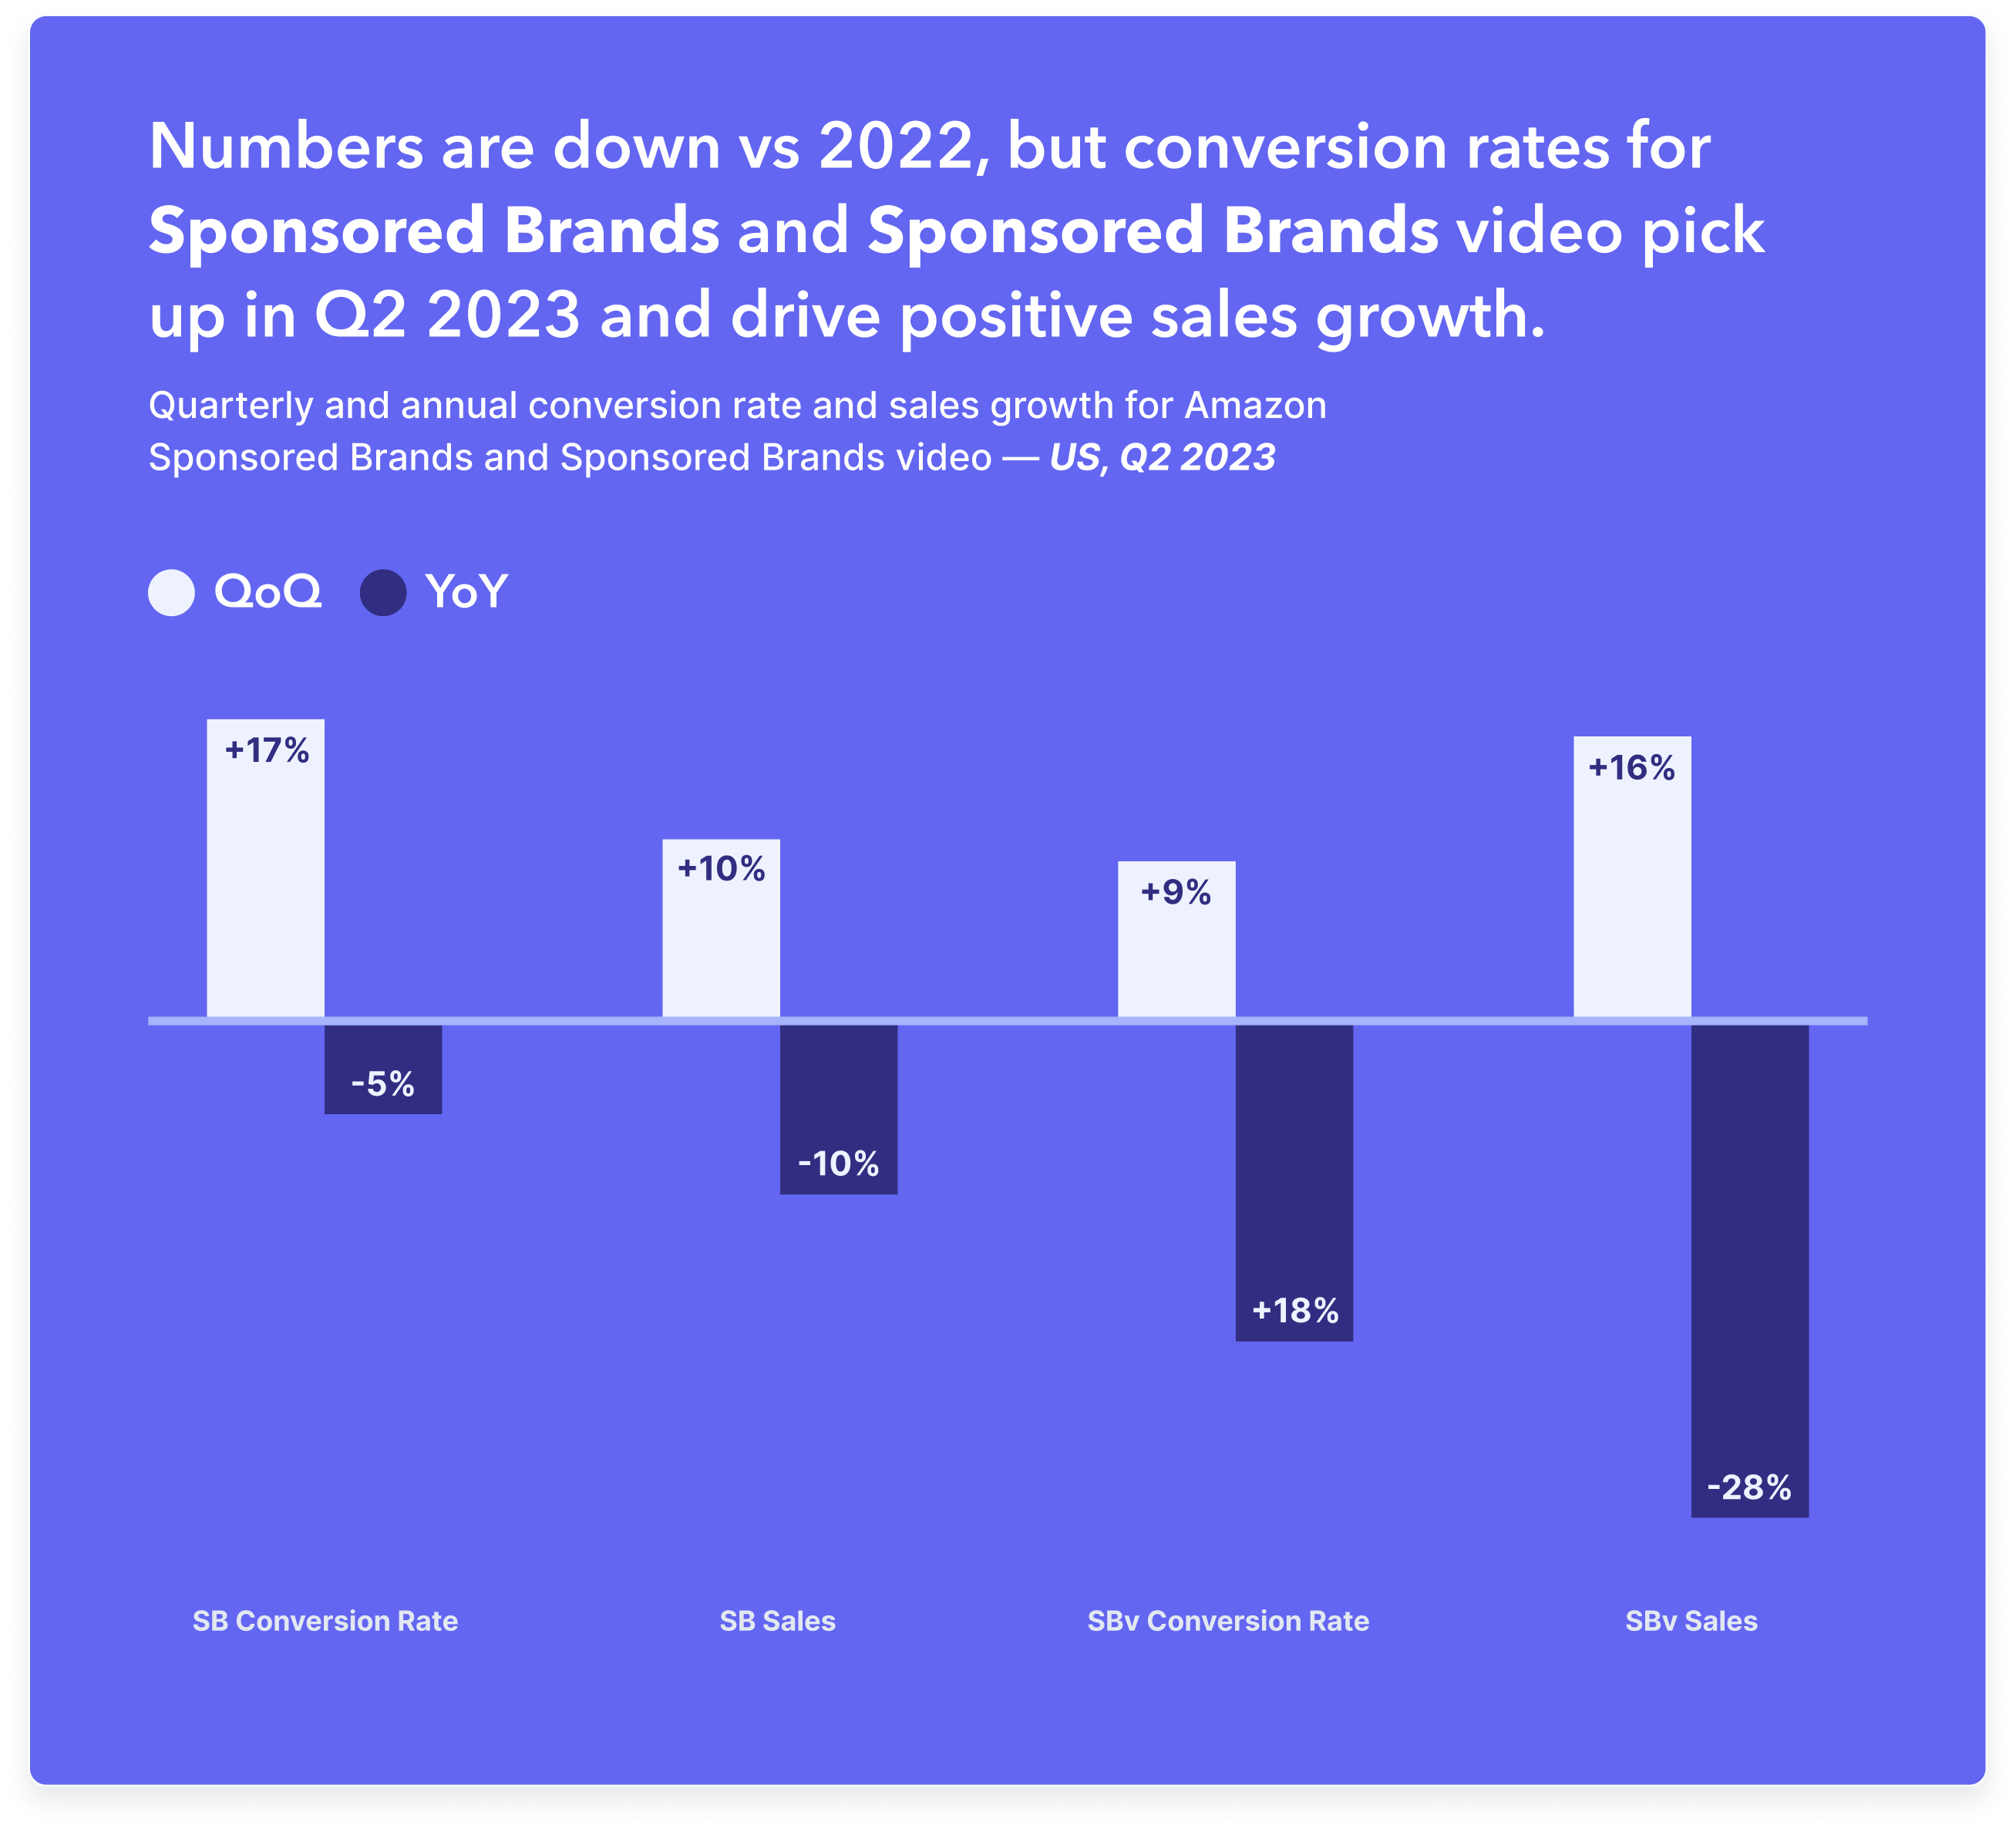
The conversion rate trends are much more closely connected to sales growth (or decline) than the impression or CTR trends shown above. In Q2 2023, even though CTRs for Sponsored Brands and Sponsored Brands video were flat, the rising conversion rates (+17%, +9% for video) helped sales go up quarter-over-quarter (+10%, +16% for video). Similarly, year-over-year drops in conversion rate coincide with negative sales growth.
Based on this analysis, as an advertiser running Sponsored Brands campaigns you should:
Ensure that you understand why you are running Sponsored Brands ads and set clear targets. Choose a primary KPI that corresponds to your goals and focus on this.
Check category benchmarks so that you can meaningfully assess the performance of your own ads.
Particularly if your main focus is brand-building, make sure your Sponsored Brands and Sponsored Brands video creatives stand out as a positive brand awareness asset to maximize the impact of impressions
If your main focus is ROAS or sales, then take steps to optimize your conversion rate to capture as many sales as possible from those that click.
Are your Sponsored Brands ads capturing new-to-brand customers?
If you have an ad format with a falling CTR and a rising conversion rate, then this could suggest that a large proportion of your customers are already familiar with your products—and are therefore high converters—so you are capturing fewer new-to-brand purchases.
If your strategy is retention-focused, this may be exactly what you want, but if you are aiming to expand your customer base, this could be cause for alarm. In either case, understanding who you are reaching with your ads and who is converting is key to making informed decisions.
To confirm a hypothesis like this, you need access to more than simple performance metrics. The Amazon Marketing Cloud (AMC) contains the data you need, and lets you conduct in-depth analyses of consumer behavior, as well as build out advanced, custom audiences to target precisely those shoppers you want to reach with your ads.
Want to learn more about AMC Audiences?
Find out how you can use Perpetua to build custom Amazon Marketing Cloud Audiences and take your targeting to the next level.
Leveraging minor holidays for major impact
Q2 might not have a Prime Day or a Black Friday/Cyber Monday weekend, but there are numerous minor holidays throughout the year that can present opportunities for brands to reach new audiences with their products. Two such holidays in Q2 2023 were Mother's Day (14th May) and Father's Day (June 18th).
To start, let's take a look at the search volumes of mothers day and fathers day throughout the quarter.
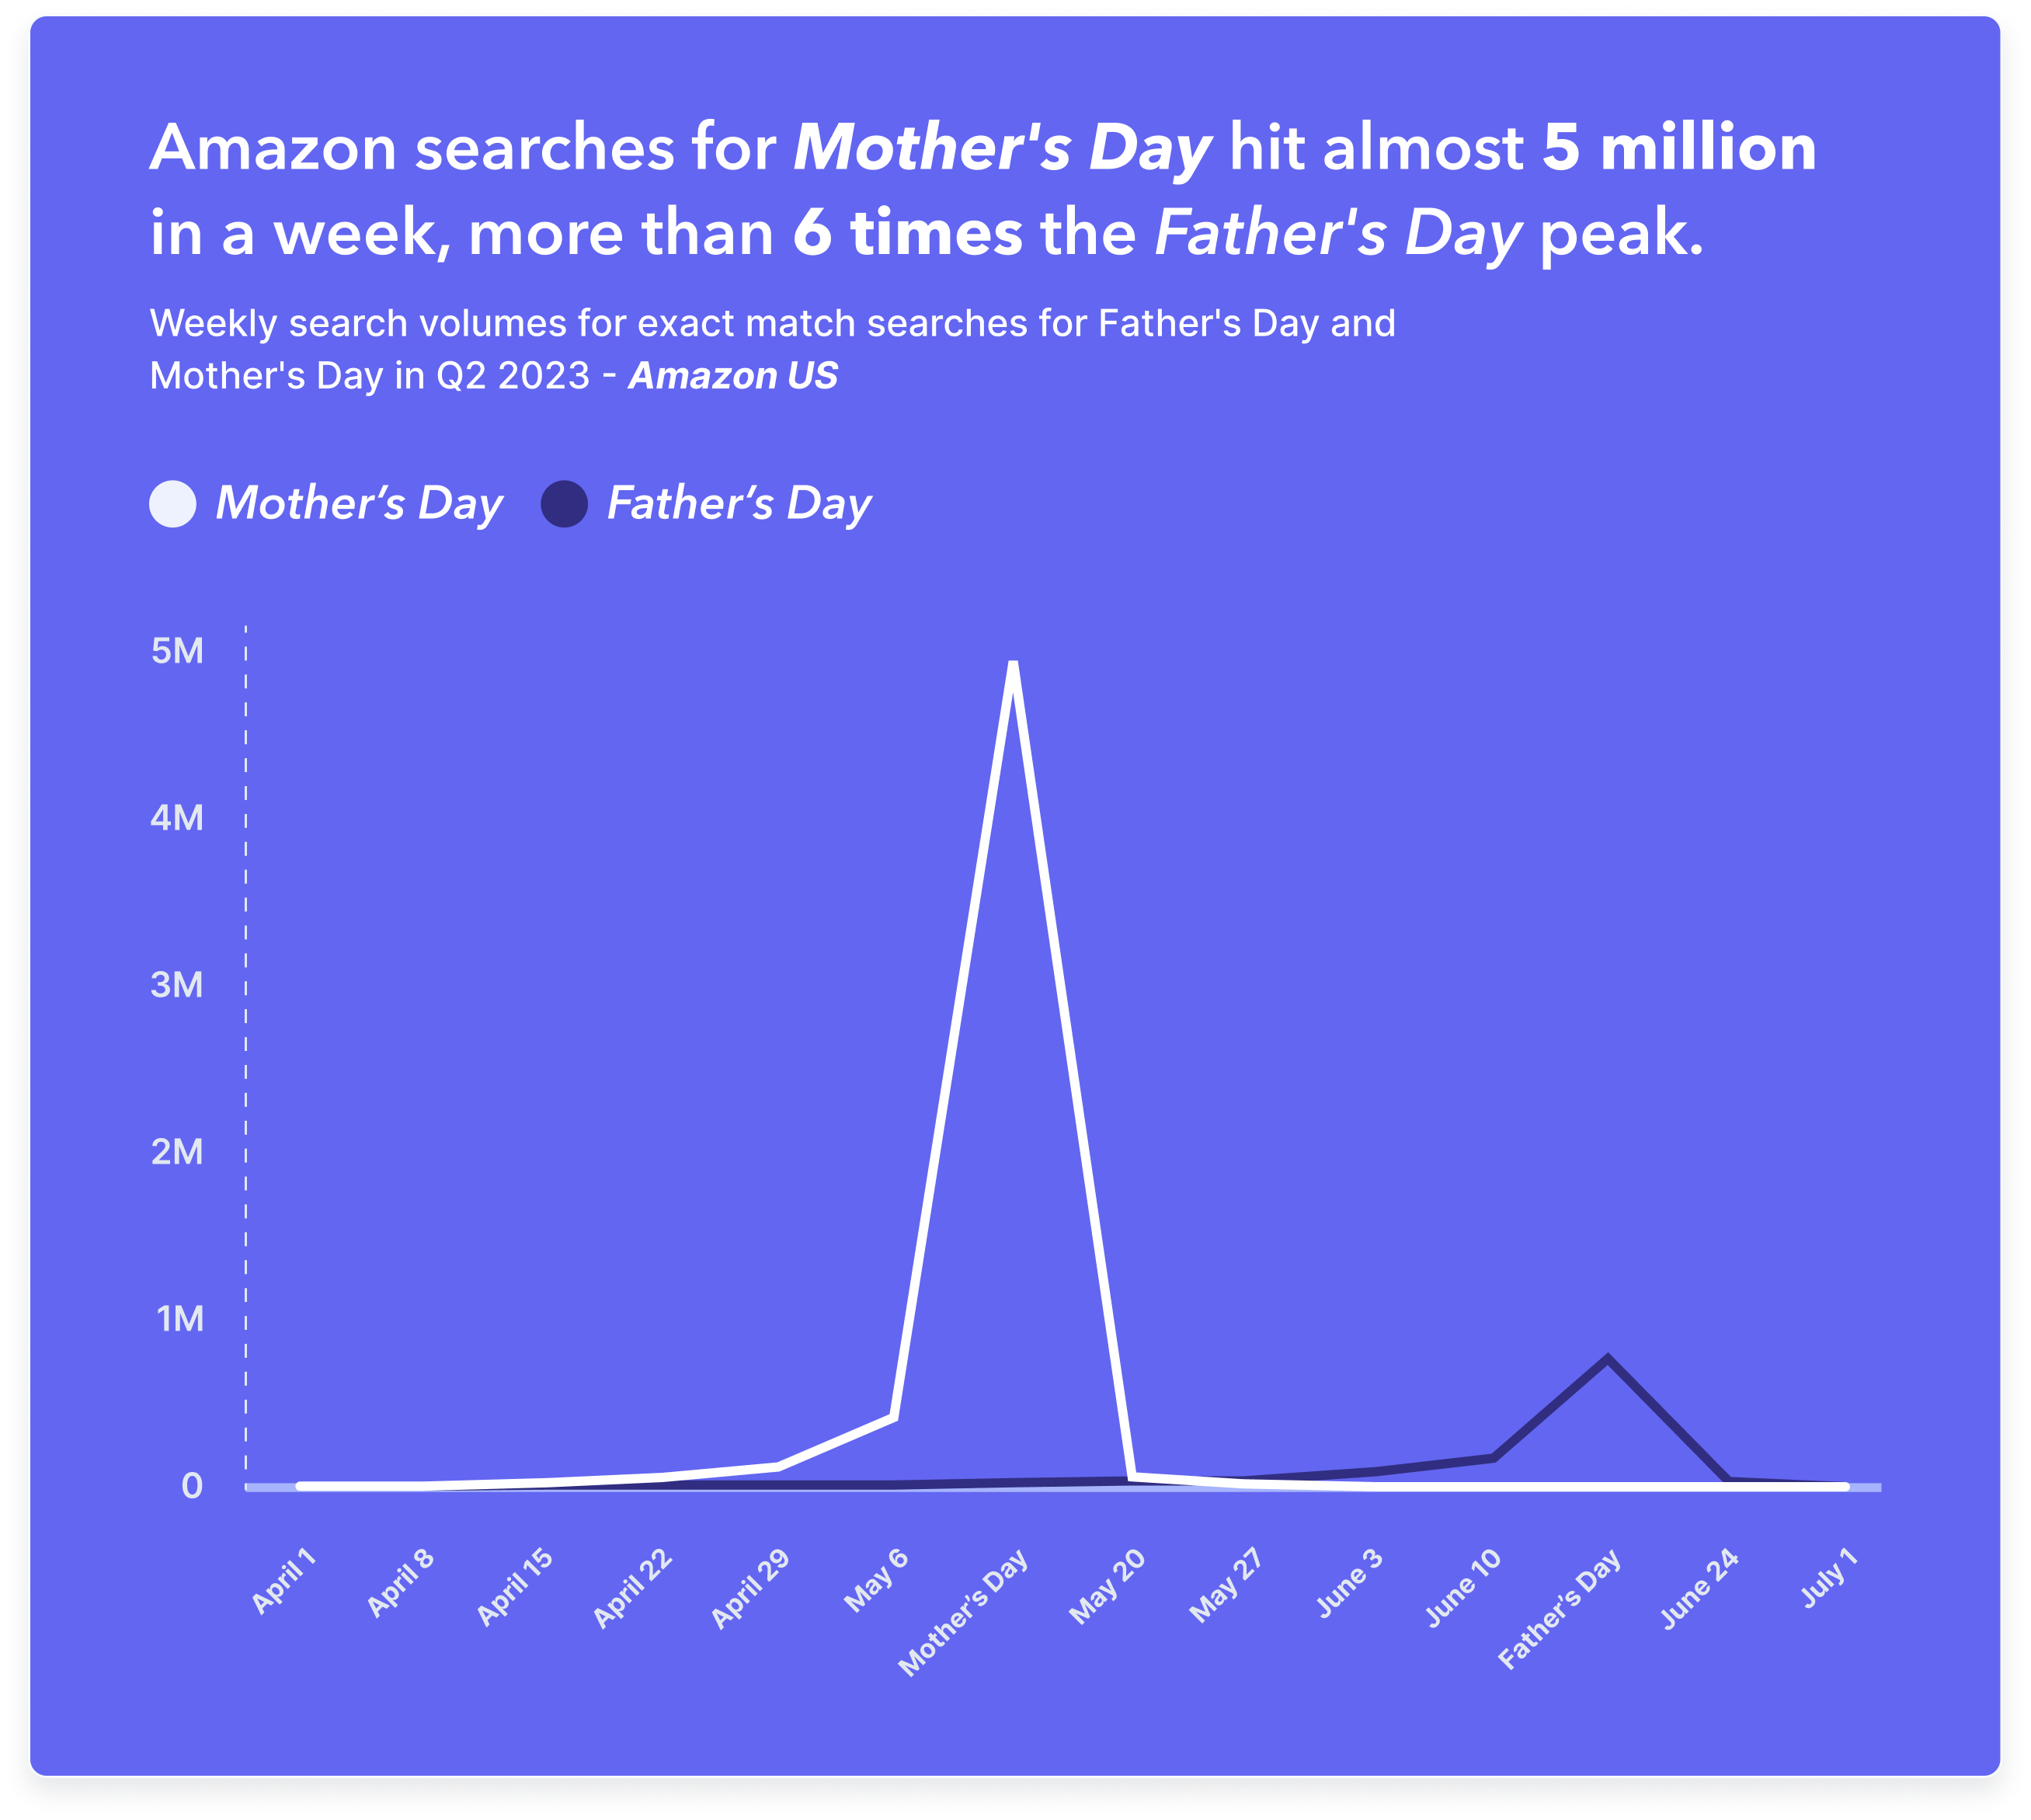
We can see that Mother's Day was more popular this year amongst Amazon searchers in the US, with the search volume for mothers day hitting almost 5 million the week of the holiday.
Capturing search intent with keyword match types
These 4.8 million searches for mothers day—and the respectable 777K for fathers day—are for the exact match keywords. To include the searches of shoppers who are specifically looking for gifts, cards, decorations, or other ideas, you can expand the reach of the keyword to phrase match targeting.
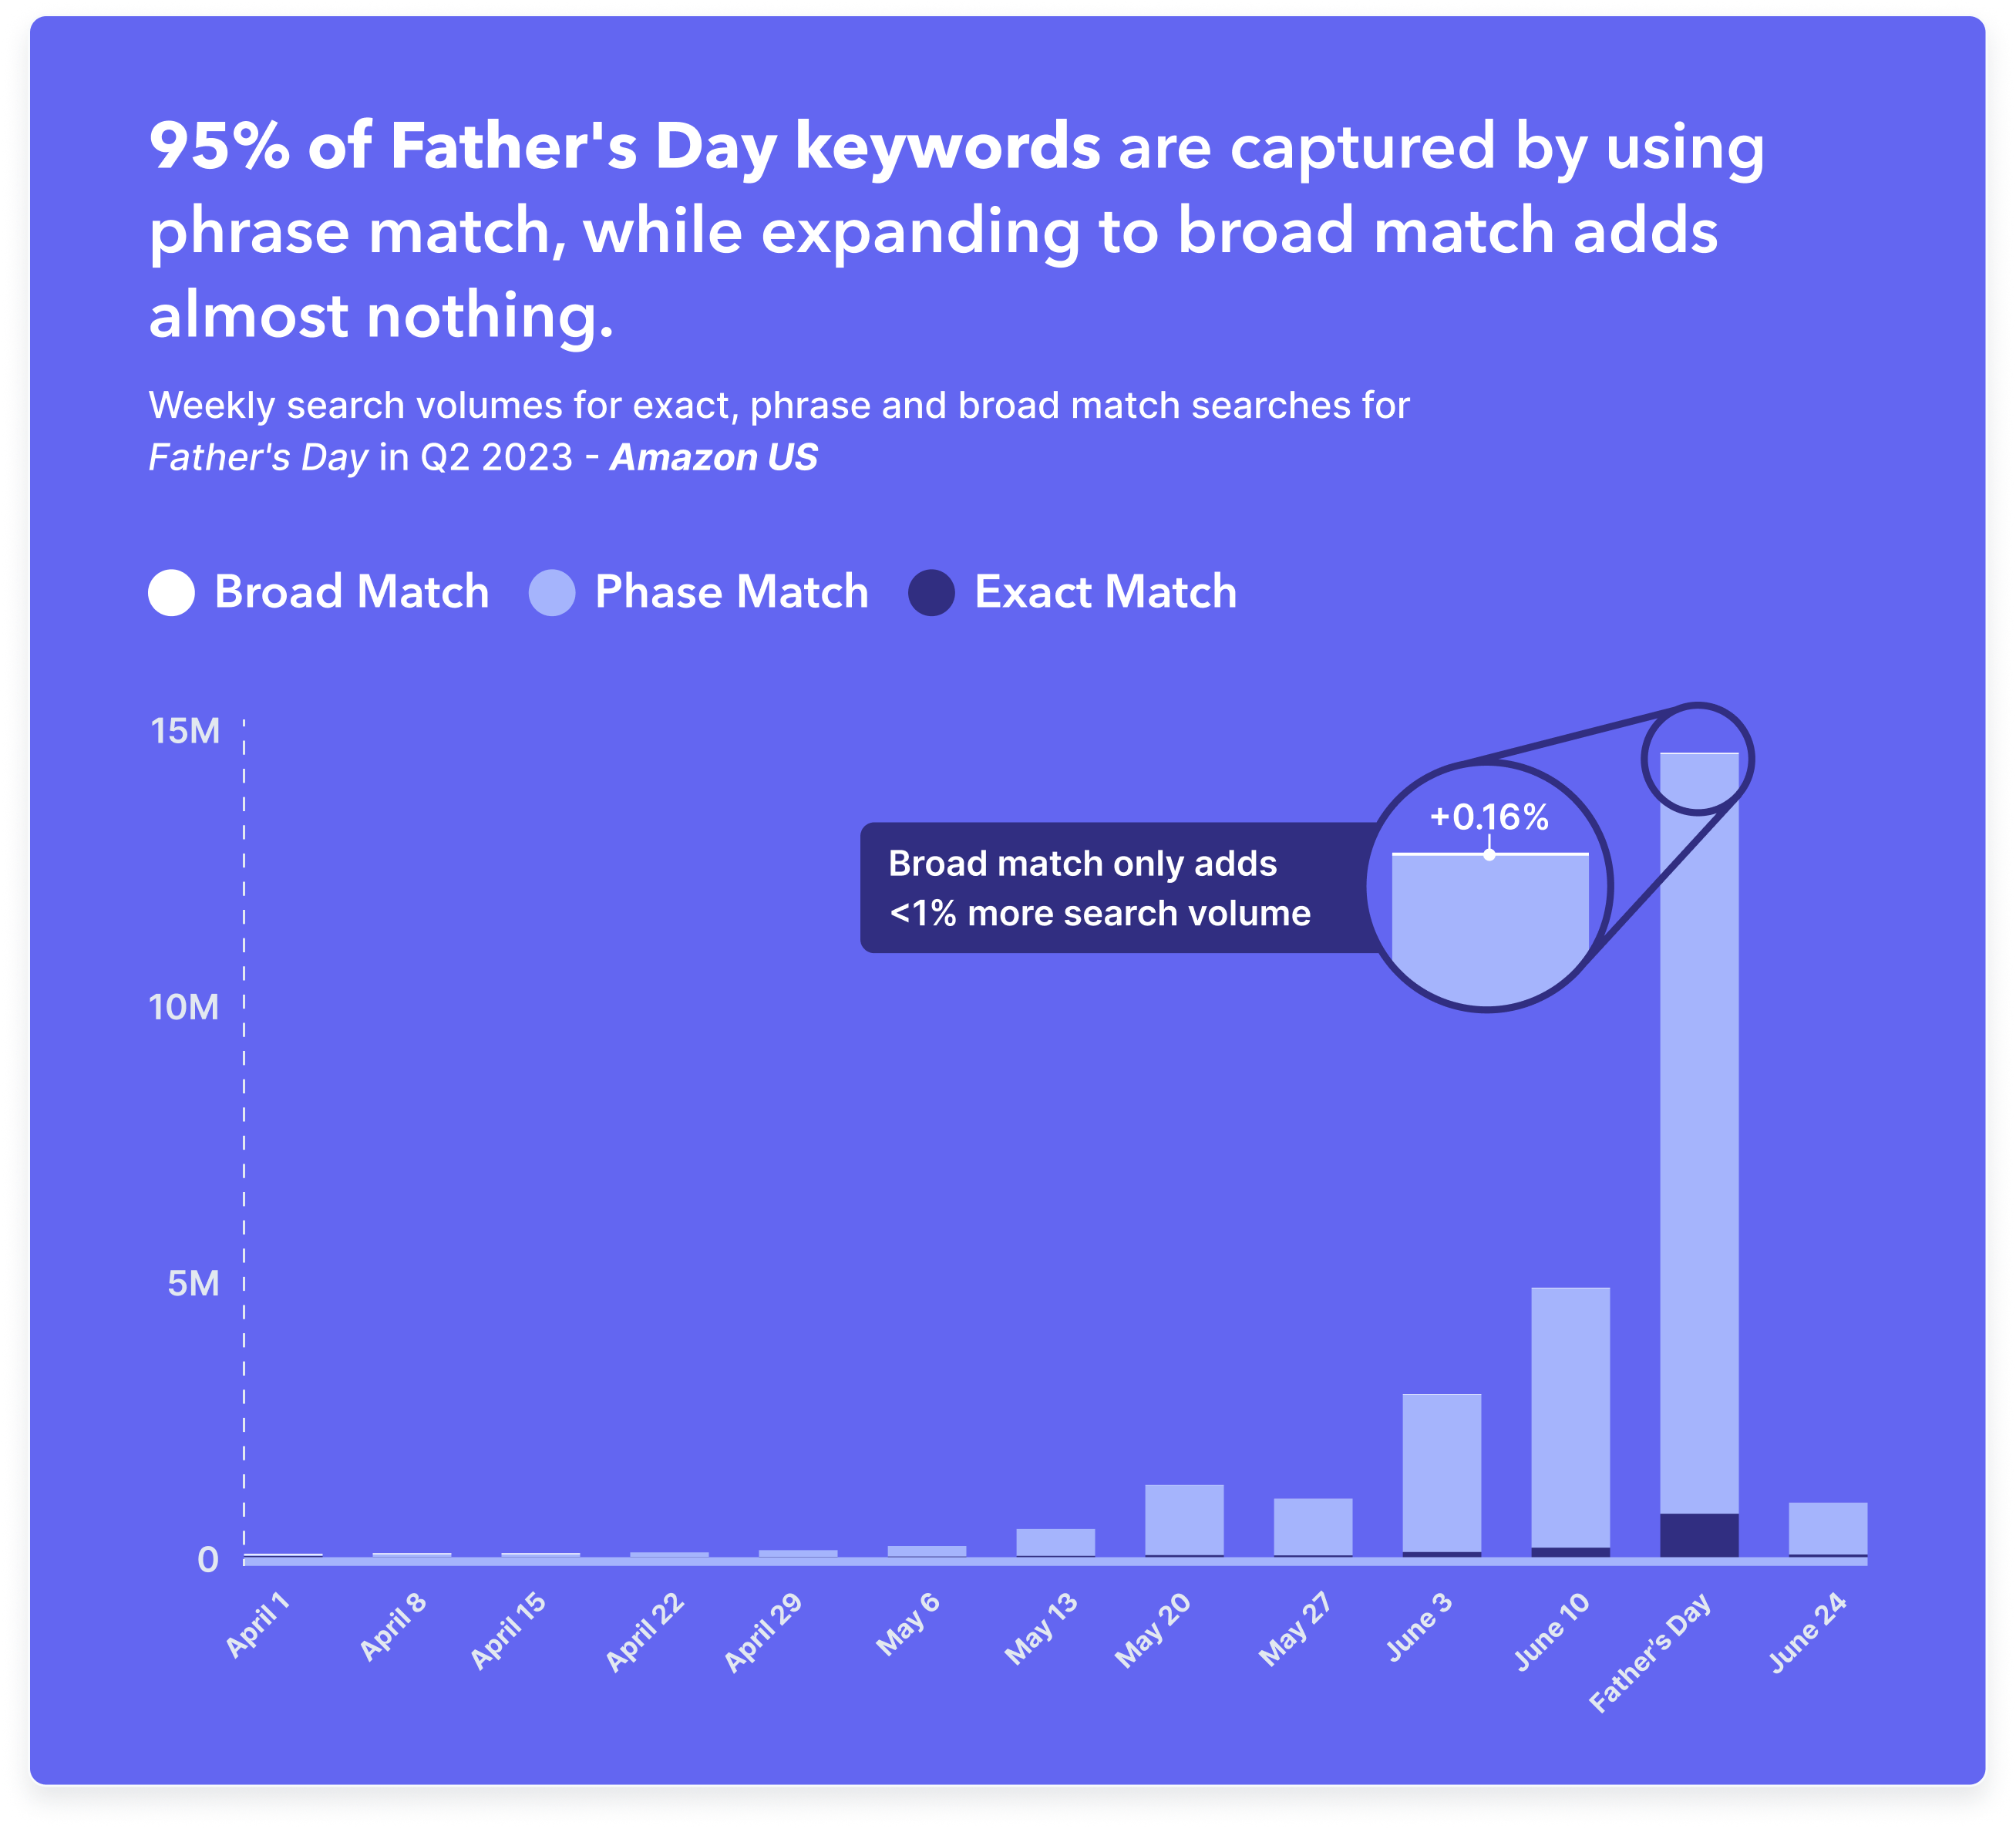
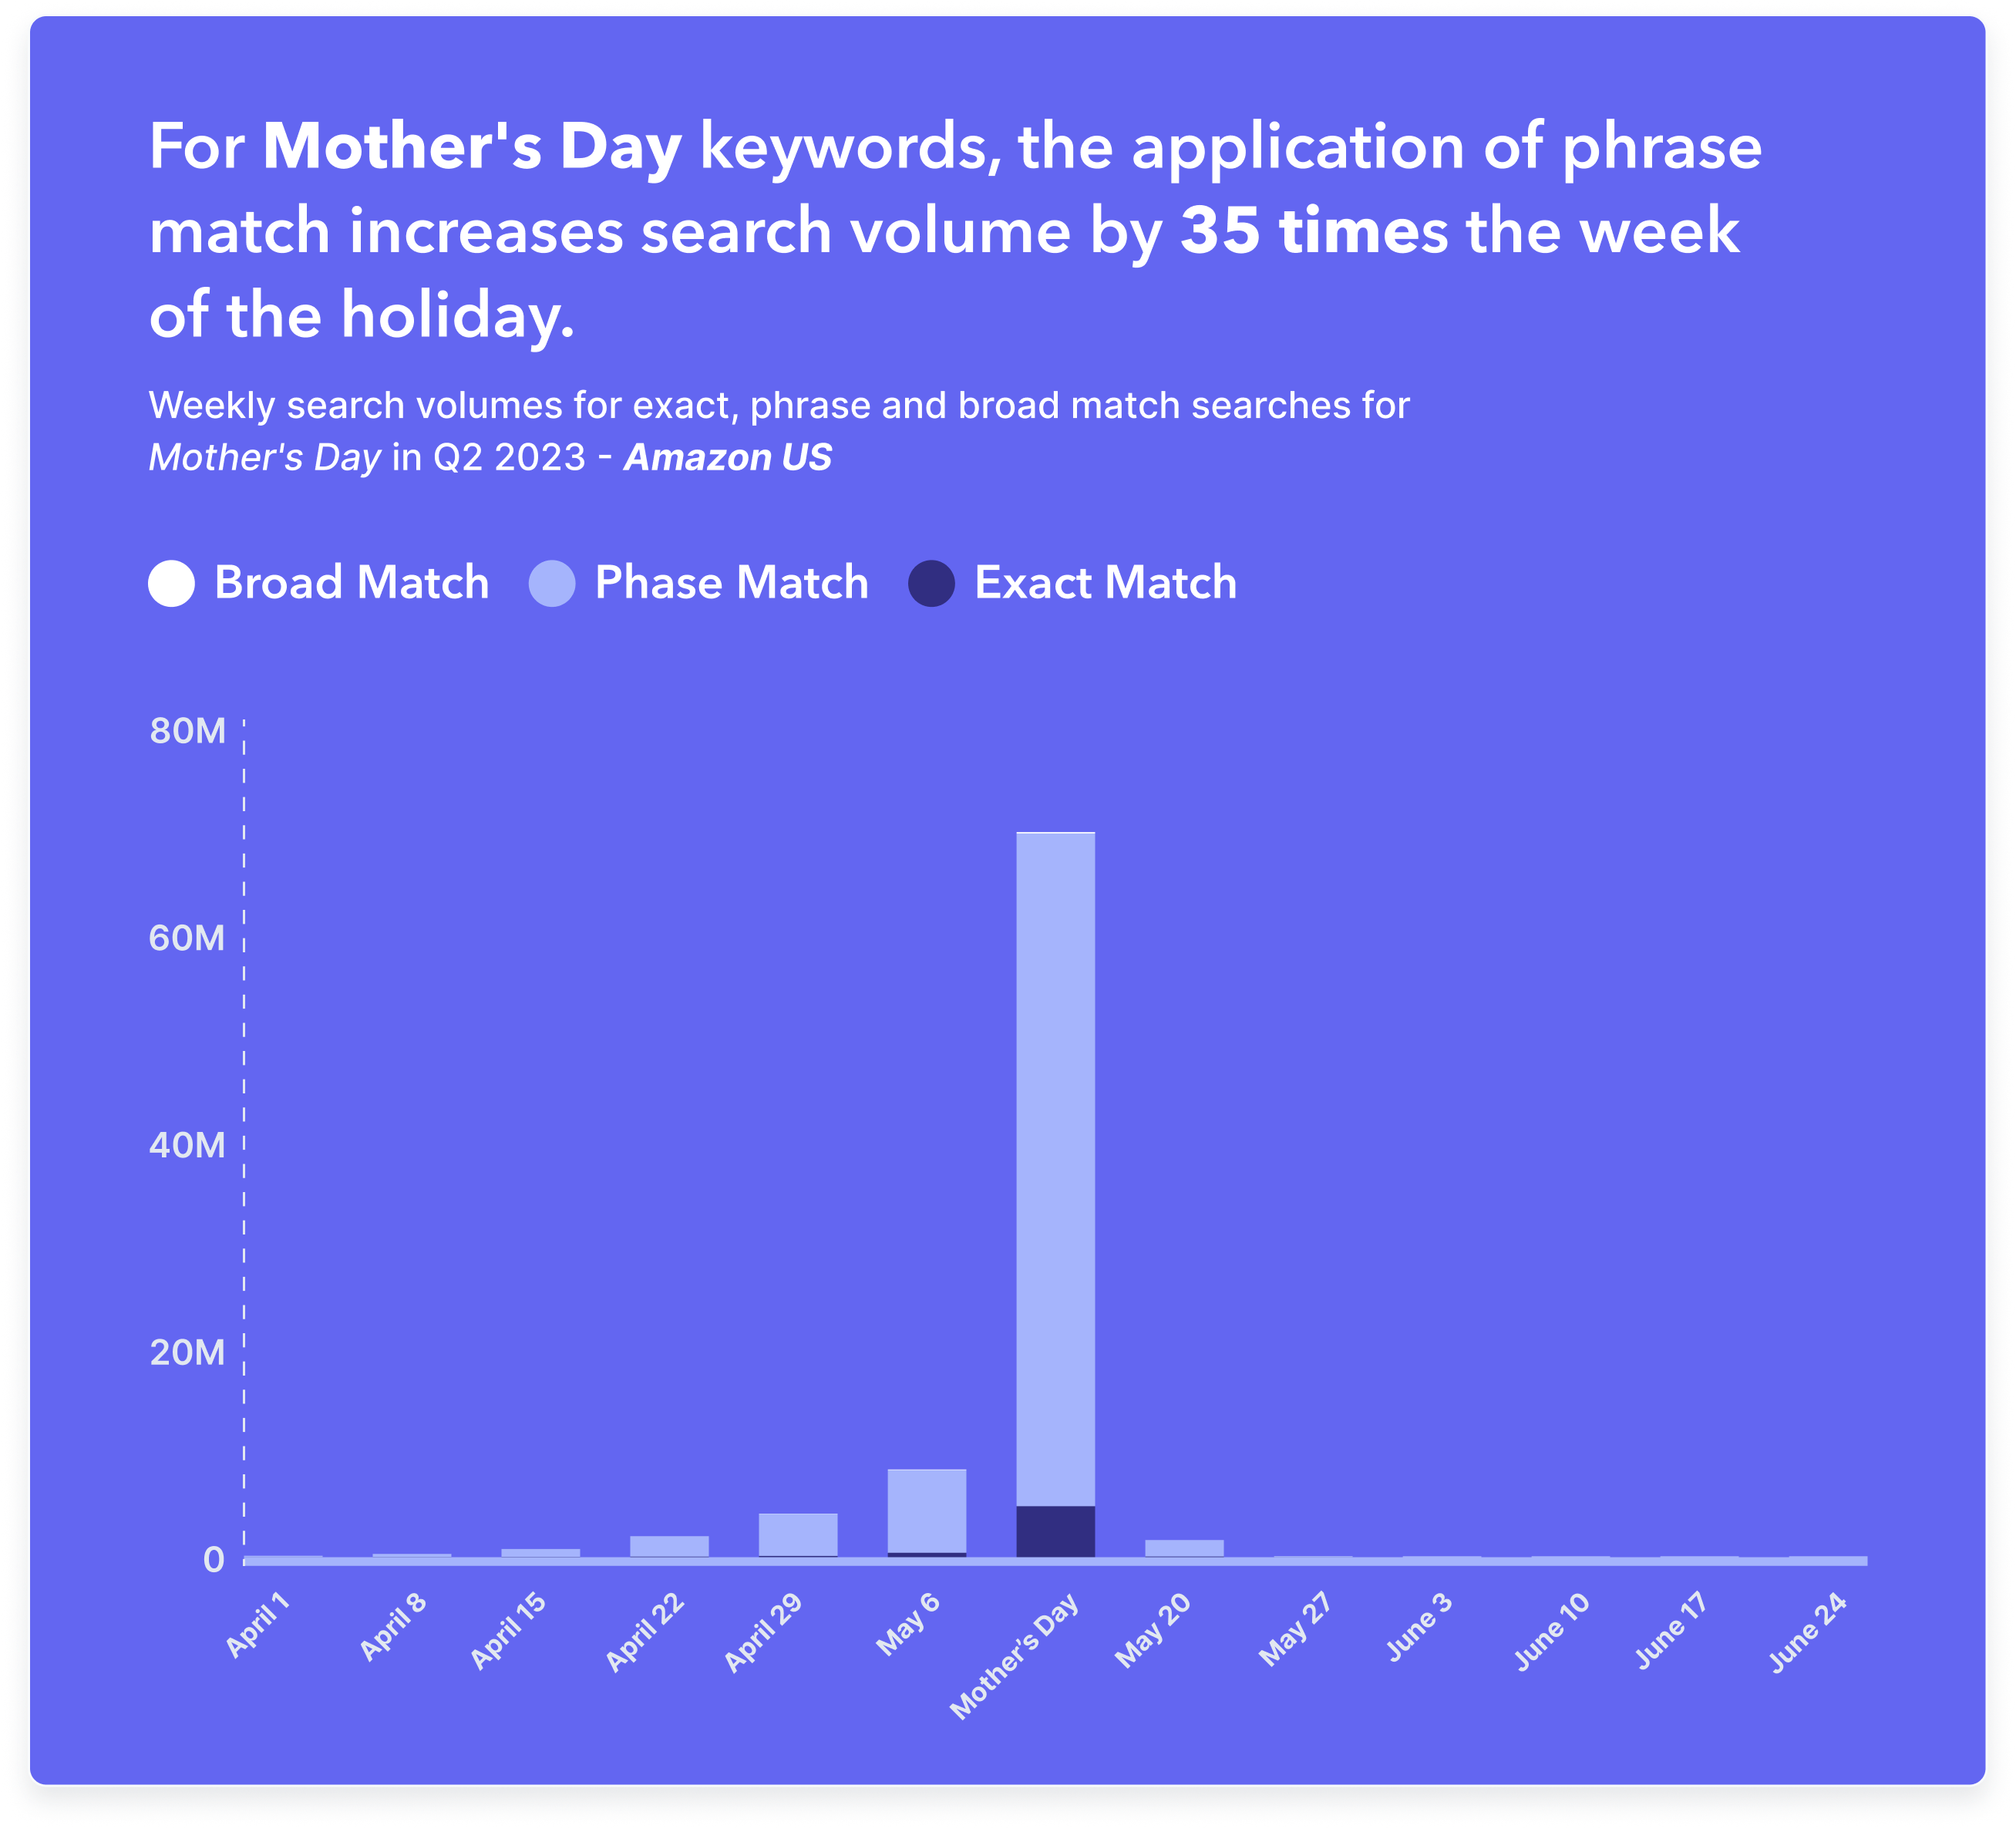
This reveals the huge impact of phrase match targeting, which, in these examples, captures more than 30 times the search volume of exact match. High-volume keywords with a clearer search intent include mother's day gift ideas, mothers day gift basket, fathers day gifts from daughter, or fathers day gifts from wife.
Utilizing simple keyword match types is one of the most fundamental—yet still highly powerful—levers that advertisers have for controlling the number of impressions their ads get. We saw earlier how Amazon influences the volume of Sponsored Brands ads displayed to shoppers, but this doesn't mean you are at the mercy of the platform. If you take control of who sees your ads, and how often, then you can show up in repeat searches, build brand stickiness, and drive success.
How broad is broad match targeting?
In the previous example, changing the match type from phrase match to broad match added very little search volume (less than 1%, highlighted right). This is because "father's day" and "mother's day" are almost always searched for as contiguous phrases.
But it's not always like this. In fact, Amazon recently rolled out an update to the definition of broad match for Sponsored Products, meaning that more search terms—broadly speaking synonyms or words of near-similar meaning—are now covered. As an example, we can look at the impact of how this new broad match can boost the search volume for a keyword like women's shoes.
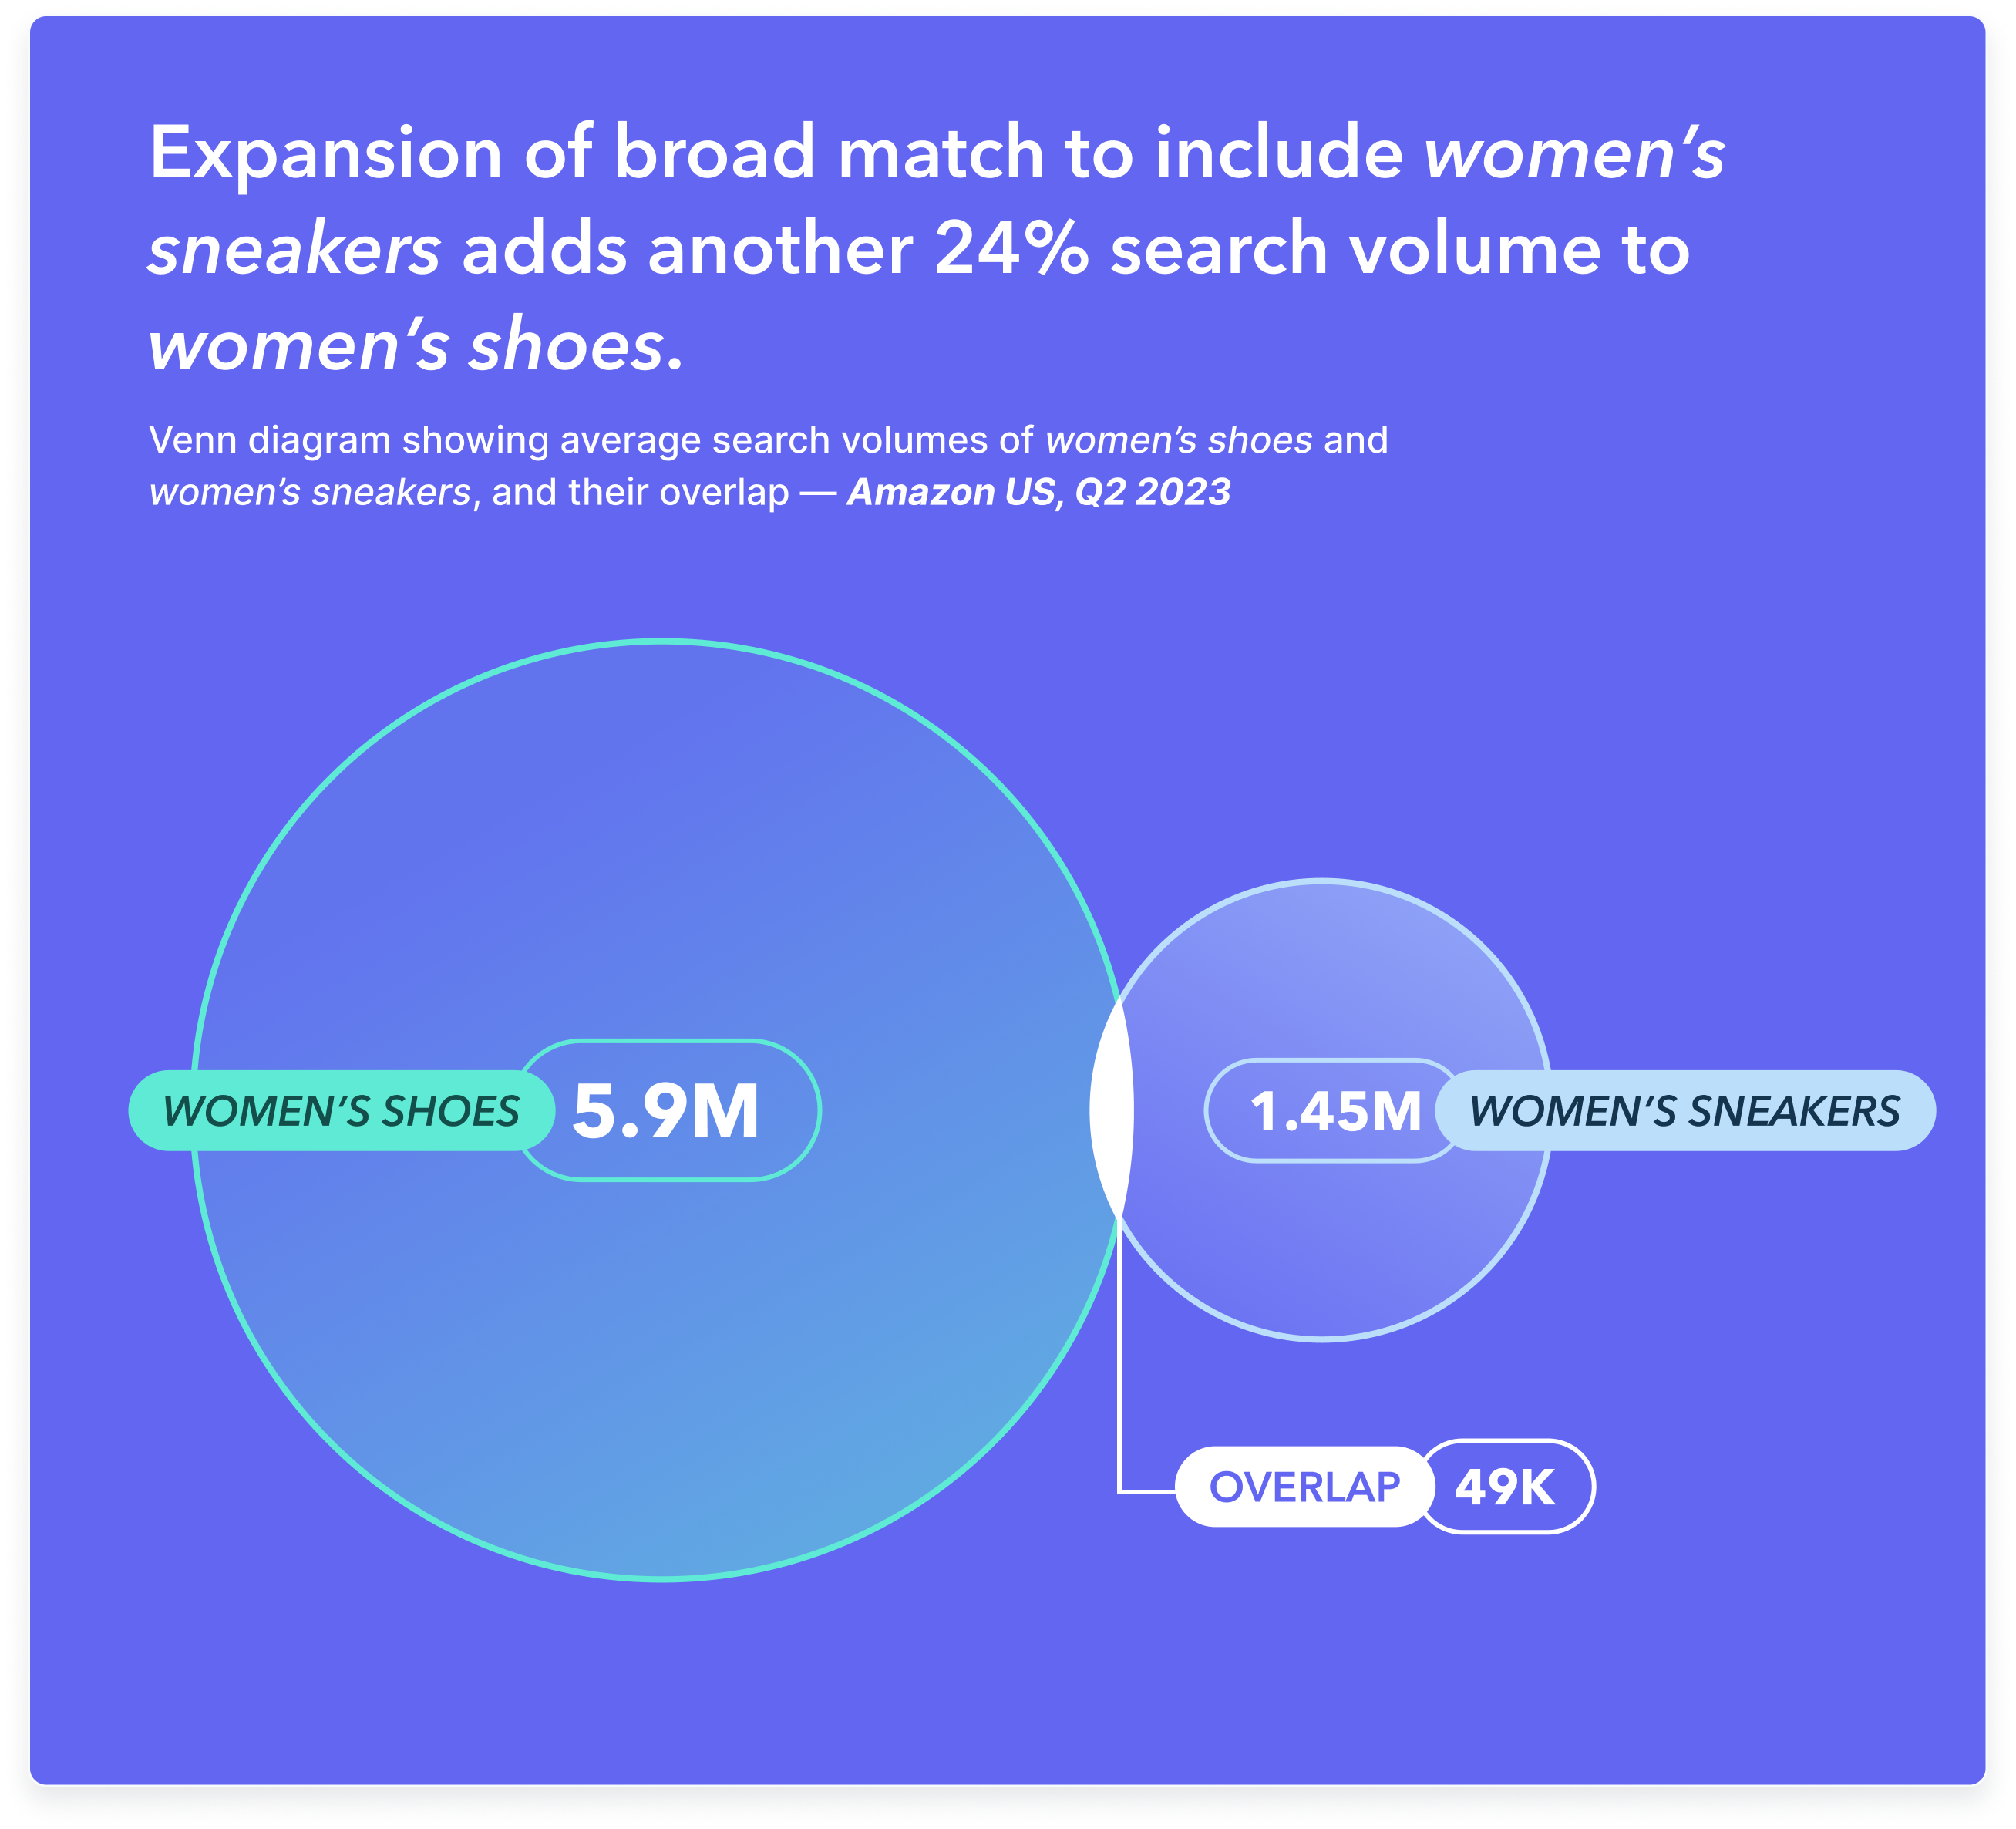
With just the additional keyword women's sneakers now included, that's already another 1.4 million searches you're targeting. Understanding which search terms—and therefore which variety of search intents—your ads are displayed for is a vital part of ensuring that you're investing your ad budget efficiently and bidding on keywords that will help you reach the right audience.
Conversion rate benchmarks for Amazon Sponsored Products in Q2 2023
We saw earlier that the overall benchmark conversion rate for Amazon Sponsored Brands ads (and Sponsored Brands video) recovered in Q2 2023, but was down on the annual trend. For Sponsored Products ads, conversion rate is a critical metric, as these are usually focused on directly driving sales at the bottom of the funnel.
However, as well as each ad format having different advertising benchmarks, each product category is unique too. The metrics also fluctuate differently throughout the year, impacted by category-specific holidays, seasonality, and external trends.
While the conversion rate for most Sponsored Products categories went up in Q2 2023, we saw particularly strong performance for Pet Supplies, where 17.5% of clicks resulted in a sale, which is an increase of over 20% versus Q1.
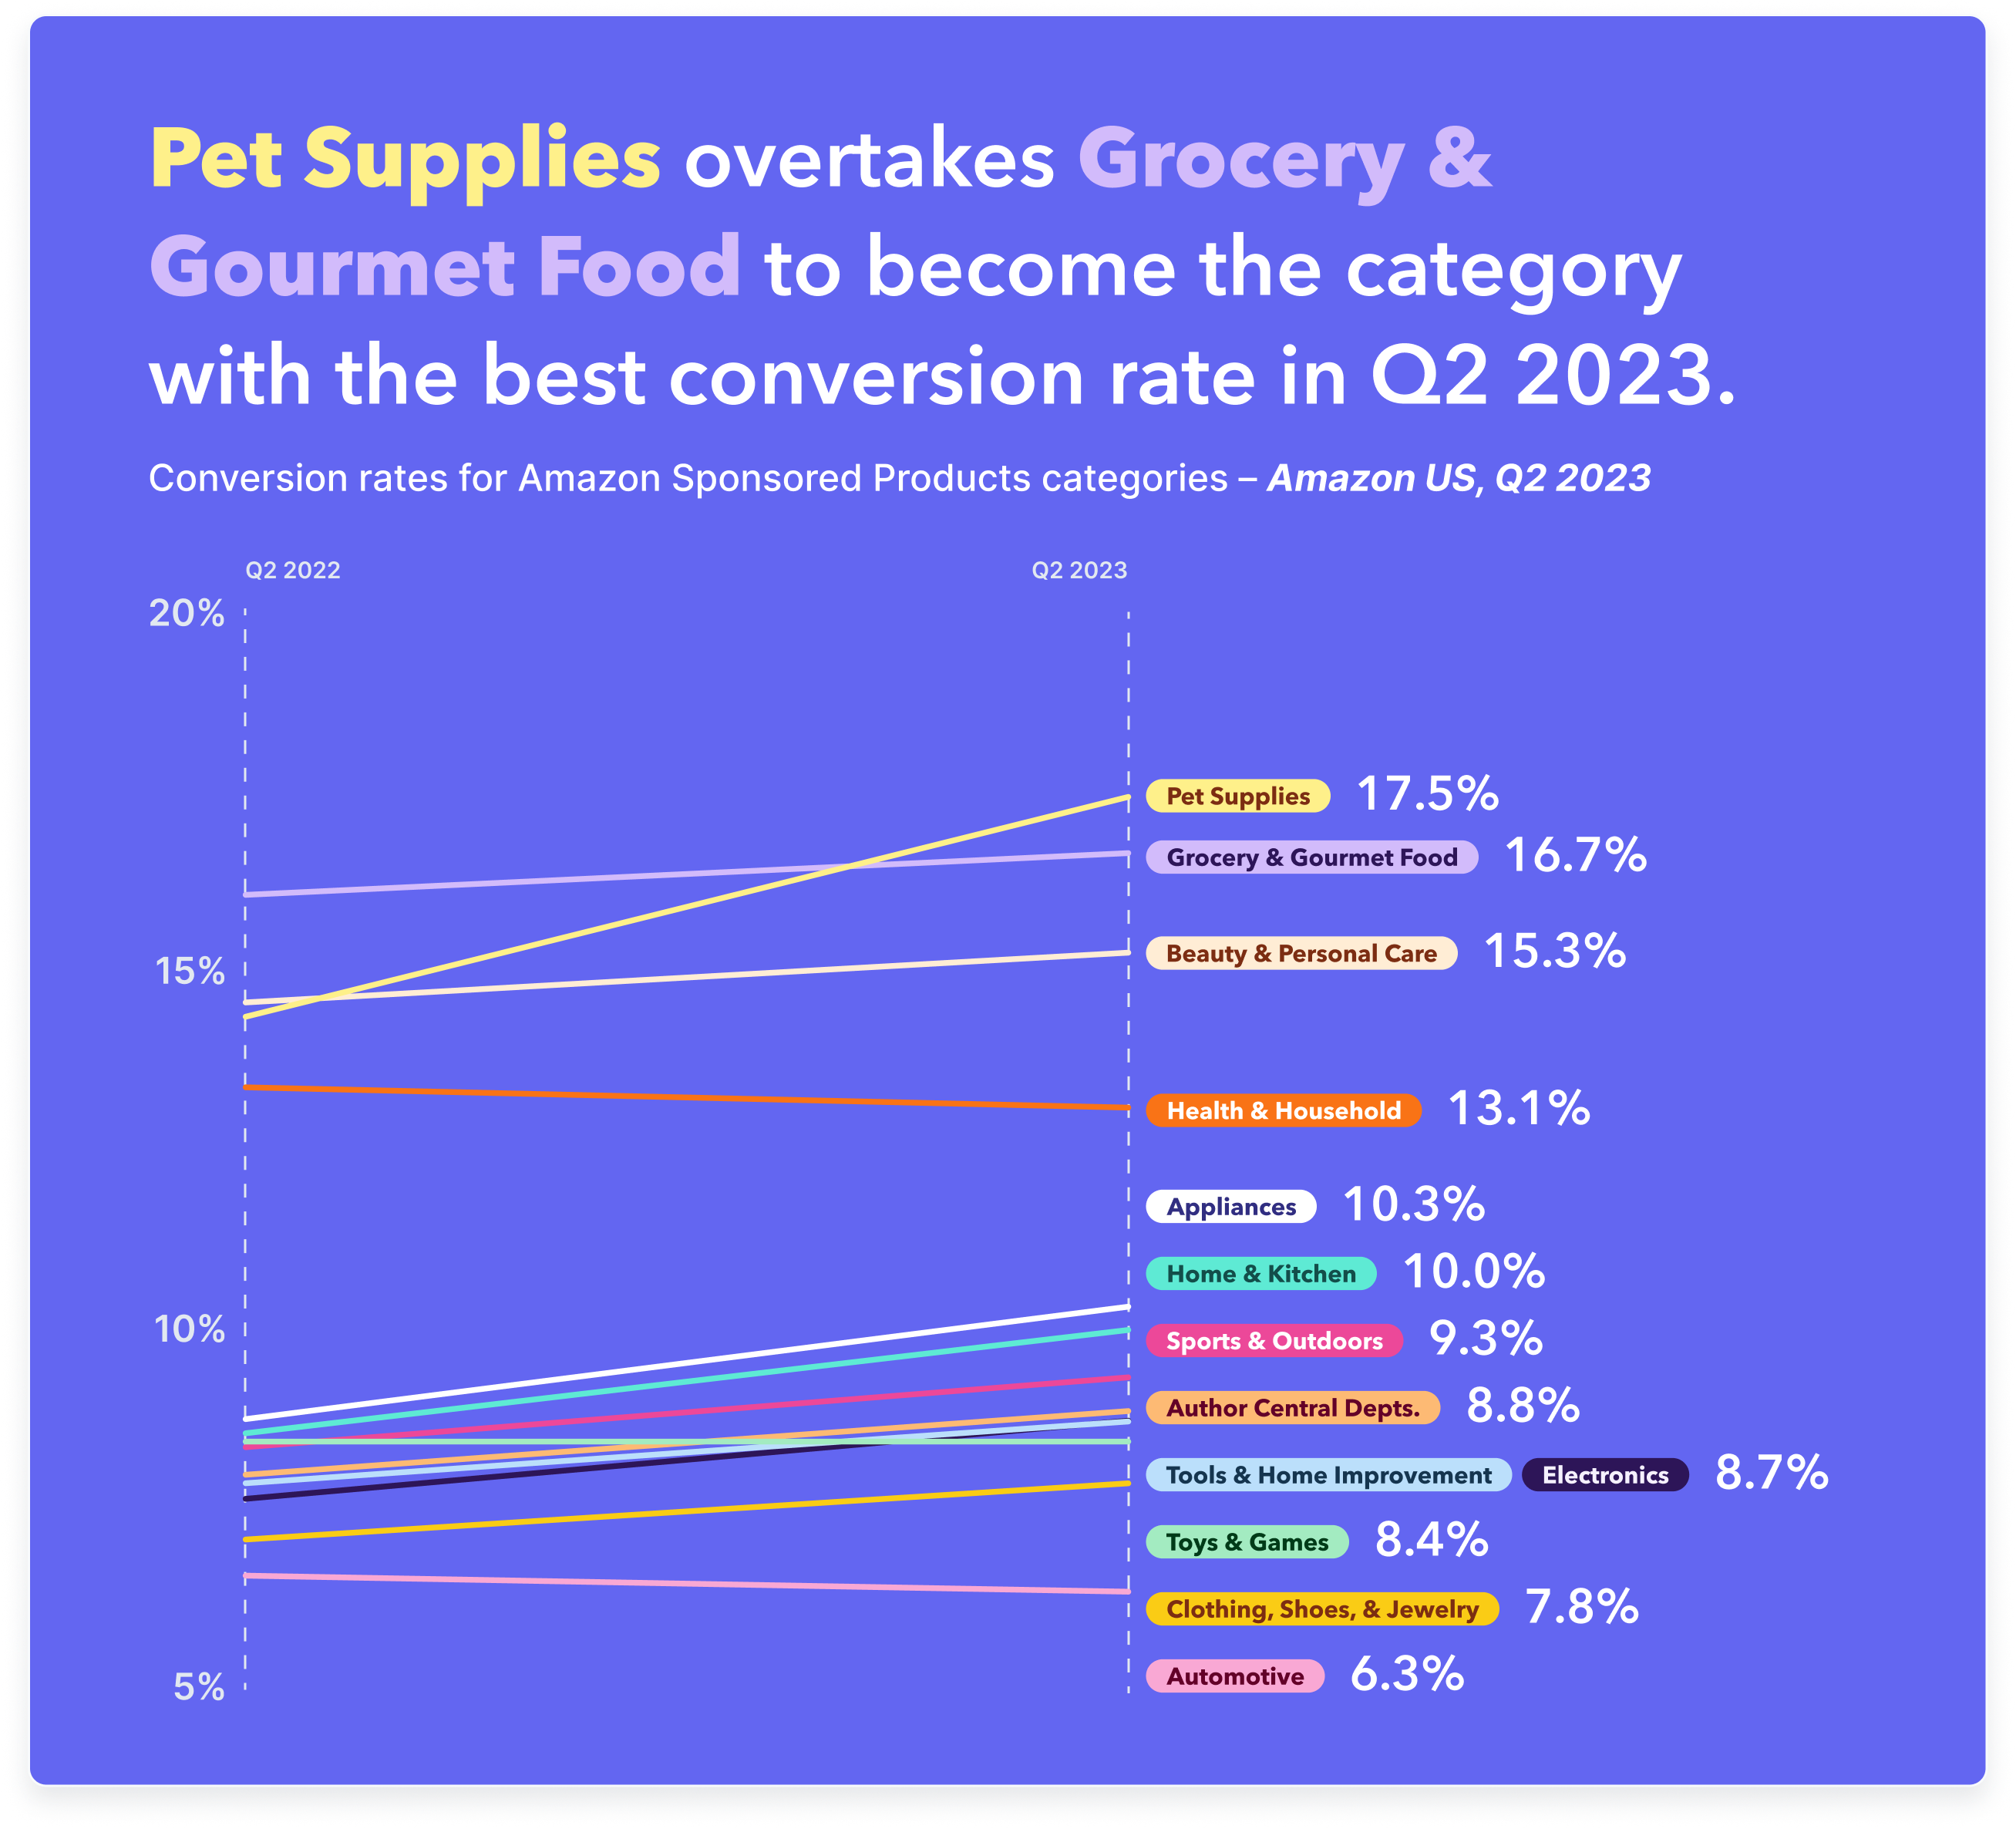
Categories with consumable products like Pet Supplies, Grocery & Gourmet Food, or Health & Household are tailor-made for customer retention. If you understand your products' purchase cycle, you can craft retargeting campaigns to reach customers at the right moment for a repeat purchase, and ensure you maximize the impact of your ad budget.
As a final note on conversion rate benchmarks, our Q2 2023 Benchmark Report for North America also analyzed performance by targeting type, and found that the conversion rate for competitor-targeted campaigns went up 10% in Q2. This proves that customer retention is no gimme, and loyalty isn't to be taken for granted. You need to defend your own brand but you also have a chance to capture new customers from competitors, which can lead to a huge pay-off later in the year.
Conclusion: Amazon Advertising benchmarks matter
This analysis of Sponsored Brands, Sponsored Brands video, and the relationship between impressions, click-through rate, and conversion rate benchmarks, has given us insight into Amazon advertising trends, and highlighted once again how specific they are to ad format, product category, and the time of year.
And this is why benchmarks matter. If you understand how consumers engage with a specific ad format and product category, then you can assess trends and judge your own performance against relevant competitors, letting you evaluate the effectiveness of your own strategies, and inform the creation of more successful campaigns.
Looking for more Q2 data and insights?
Read our Q2 2023 Benchmark Report for North America for all the latest benchmarks for Amazon Sponsored Products, Sponsored Brands, Sponsored Brands video, and the Amazon DSP. It also includes category trends, metrics by placement, and benchmarks for Walmart, Target, and Instacart. Explore the state of eCommerce in 2023 by downloading your free report today.