
Study: Intraday Optimization - Hourly Amazon Ad Performance Data and Strategies
Stephen Bench-Capon, June 30, 2022
Introduction – What is intraday reporting and optimization?
With Amazon’s latest product, Amazon Marketing Stream, advertisers now have access to campaign performance by hour of the day, and day of week. This includes metrics like ACOS, CPC, conversion rates, ad sales, ad spend and more.
Equipped with this data, advertisers can track when key metrics peak and fall throughout the day and week, understanding how their budget is being allocated and where there is opportunity to be more efficient or adjust bids to better align with their strategies.
With our new feature Perpetua Stream, currently available for North American marketplaces, we’ve integrated with Amazon Marketing Stream to bring hourly performance data straight to our platform to easily analyze and identify intra-daily trends, and quickly take action on them. Heatmaps viewable by goal or campaign allow you to see within seconds when your key metrics rise or fall.
Additionally, at Perpetua, share of voice (not available via Amazon Marketing Stream) is being tracked hourly across over 100k terms (with the option to add custom terms), making it easier for advertisers to see when they own the page and on which terms.
With Perpetua Intraday Bidding, once advertisers know exactly when they need to be bidding differently, they can build automatic schedules to increase (up to 10x) or decrease bids for each hour of the day and day of week.
Pro and enterprise users of Perpetua's eCommerce advertising optimization and intelligence software can use Perpetua Stream, which empowers them to not only view and analyze this hourly reporting data, but also to easily pull the levers that give their ad campaigns a level of sophistication not accessible to their competitors.
What does this study show?
This short study analyzes hourly reporting data for Amazon Sponsored Products in the US. The data is drawn from anonymized ad campaigns run by Perpetua users over a six-week period in Spring 2022.
Note that intraday reporting via the Amazon Marketing Stream is a new Amazon Advertising feature and has thus far not been available to all advertisers. Therefore, overall trends might evolve as more and more advertisers adopt intraday reporting. This study does not represent or indicate the official performance of Amazon and Amazon Advertising, or the experiences of any Amazon advertiser.
Nevertheless, by aggregating advertising data on a daily and hourly basis, benchmarks can be calculated that provide a first insight into how campaign performance and shopper behavior vary during the day and the week.
🕓 A note on timezones: Amazon uses Pacific Standard Time (PST) for its US marketplace. This is equivalent to UTC -8 or UTC -7 in Summertime. All times shown in this study are to be understood as PST.
Into the data
This study provides an overview of five core advertising KPIs:
Click-through rate (CTR): The number of ad clicks divided by the number of impressions
Cost per click (CPC): The amount of ad spend divided by the number of clicks
Conversion rate (CVR): The number of attributed conversions divided by the number of clicks
Average order value (AOV): The total revenue from ad sales divided by the number of orders
Advertising cost of sale (ACOS): The total ad spend divided by the total revenue from ad sales.
For each metric, we provide benchmark values for each hour of every day in the week, as well as the daily and hourly benchmarks.
Note that these are all ratio metrics. This means that the value is independent of the underlying volume of activity. One point to consider, therefore, is that not every datapoint has the same amount of data behind it. Quite simply, with fewer people shopping on Amazon in the night than during the day, there will be vastly fewer impressions of Sponsored Products ads at these hours. A higher click-through rate does therefore not automatically mean more clicks in absolute terms.
Categories matter: All the data here is based on the overall Amazon US marketplace. However, trends will often be specific to each product category, based on factors like:
How much research is needed for a purchase?
Is the product typically bought for work or private use?
How significant are repeat purchases?
We therefore recommend that users use the intraday reporting available in Perpetua Stream to verify these general trends for their own products, and to refine their strategy accordingly.
Click-through rate
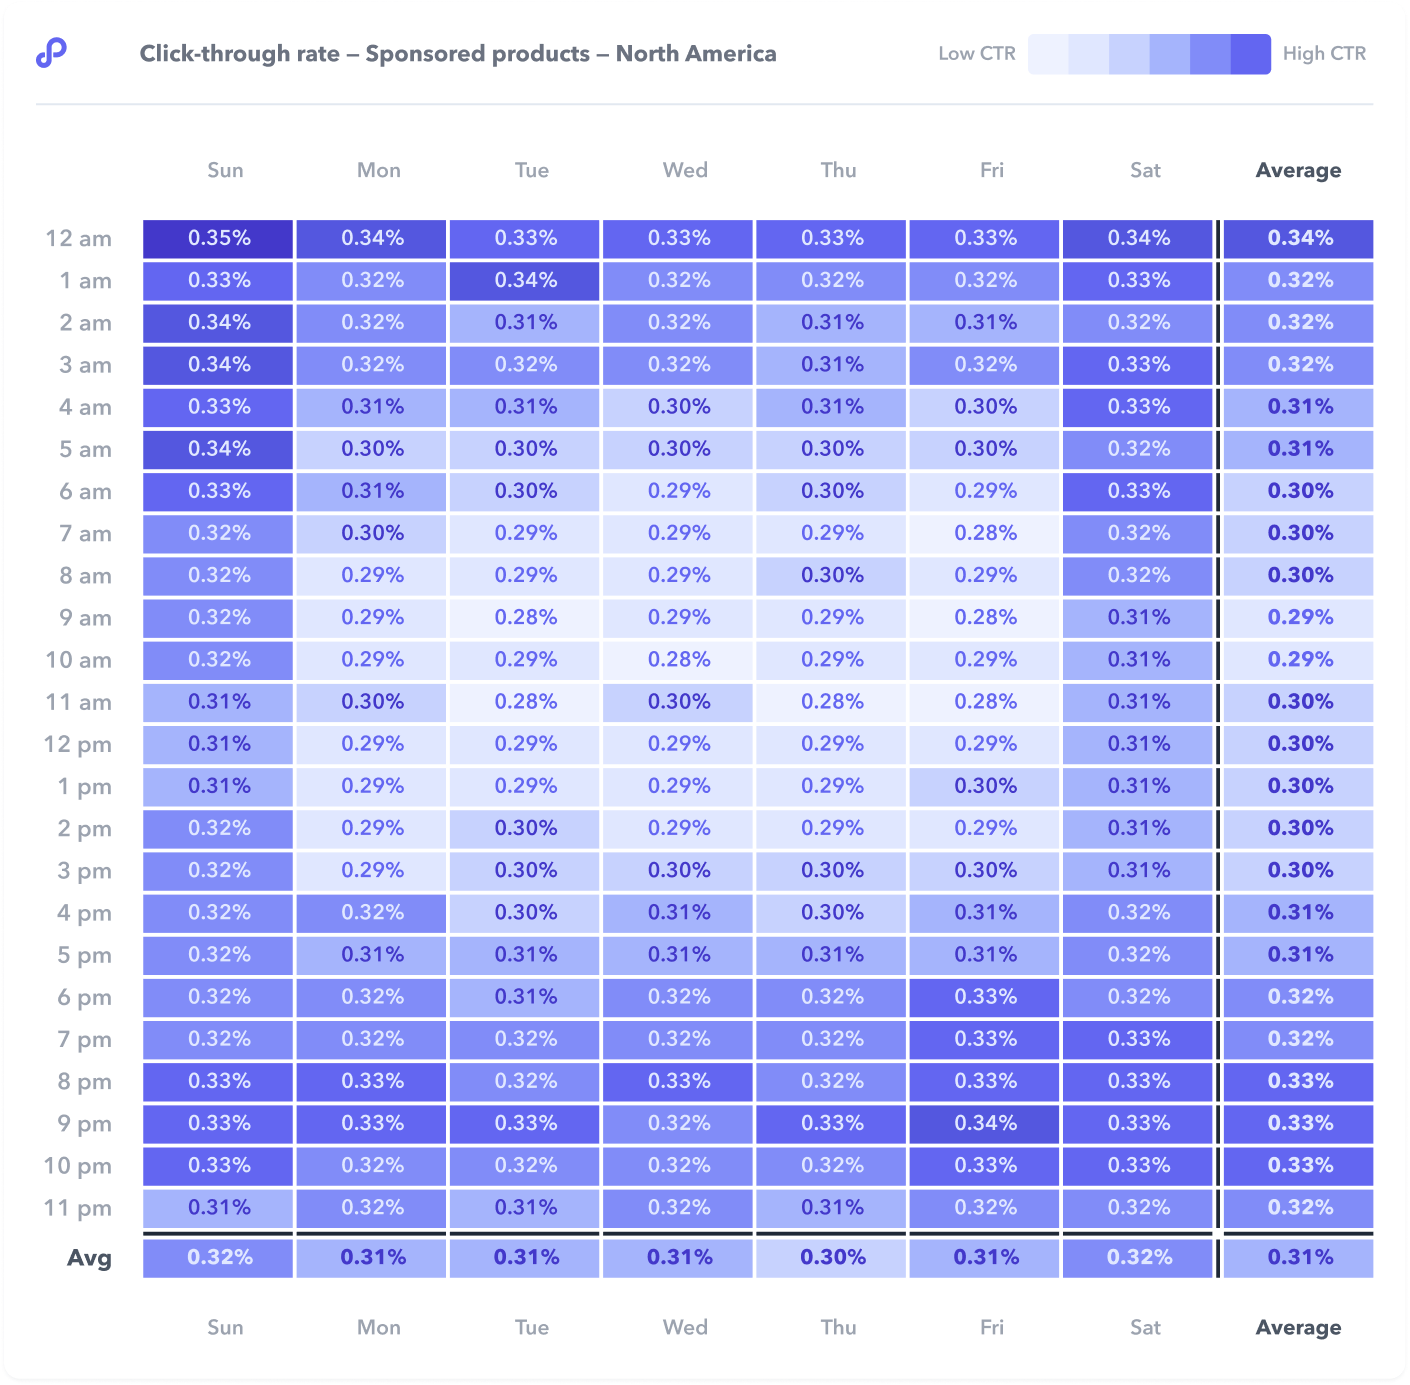
An intraday analysis of click-through rates shows the lowest values from 6:00 am to 4:00 pm PST, equivalent to 9:00 am to 7:00 pm EST.
This doesn't mean that fewer clicks are happening overall during these hours, but that shoppers are exposed to more Sponsored Products ads for every click they make.
This observation, particularly considering it is most pronounced Monday to Friday, is no doubt connected to the overlap with working hours. Those conducting purchases for work purposes (or doing personal purchases during work hours) seem to click less frequently on ads than when shopping for personal reasons outside of office hours or on the weekend.
Whilst this pattern is undeniable, it should not be overstated, as the total range only spans from 0.28% to 0.35%. The metrics presented later in the study show much more variance over the course of the day.
Cost per click
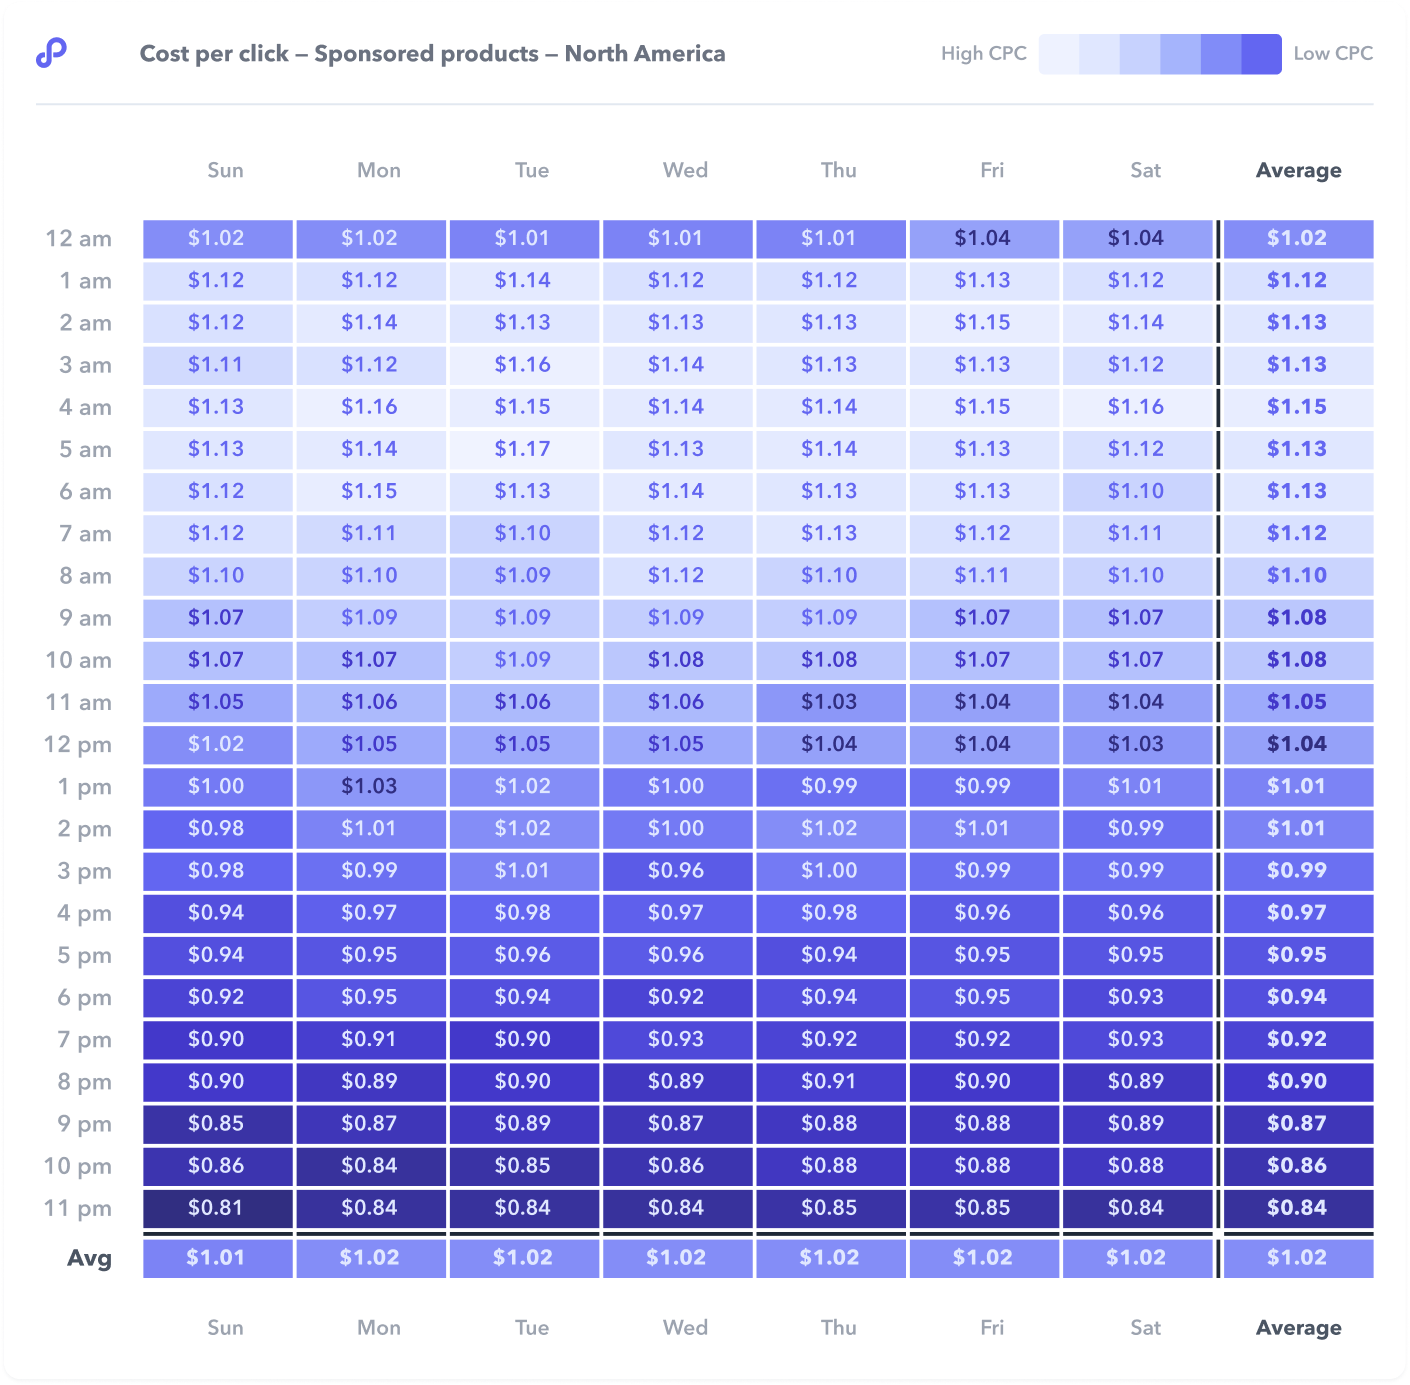
The intraday cost per click (CPC) benchmarks show a very clear trend: CPC for Sponsored Products campaigns falls steadily over the course of the day. In the early hours of the morning, the average CPC stands at $1.13, falling to $0.84 by the end of the day.
This can be most easily explained by more advertisers hitting their daily budget limits as the day progresses. This means that campaigns are automatically paused, also known as going dark, thereby lowering competition until these campaigns resume the following day. There is, however, little variation of CPCs on different days, with weekends and weekdays not significantly different.
The anomaly in the chart is the first hour of the day. This could indicate that not all paused campaigns are immediately restarted at the stroke of midnight.
If your campaigns are frequently going dark, you're not only failing to run campaigns for a proportion of the available hours in the day, you're missing out on the very times when CPCs are at their lowest.
Conversion rate
Conversion rates are dependent not only on a campaign's targeting, the quality of the information on a product detail page, and the price point, but also on shopper behavior. And shopper behavior is heavily impacted by their situation when shopping–and therefore the time of day.
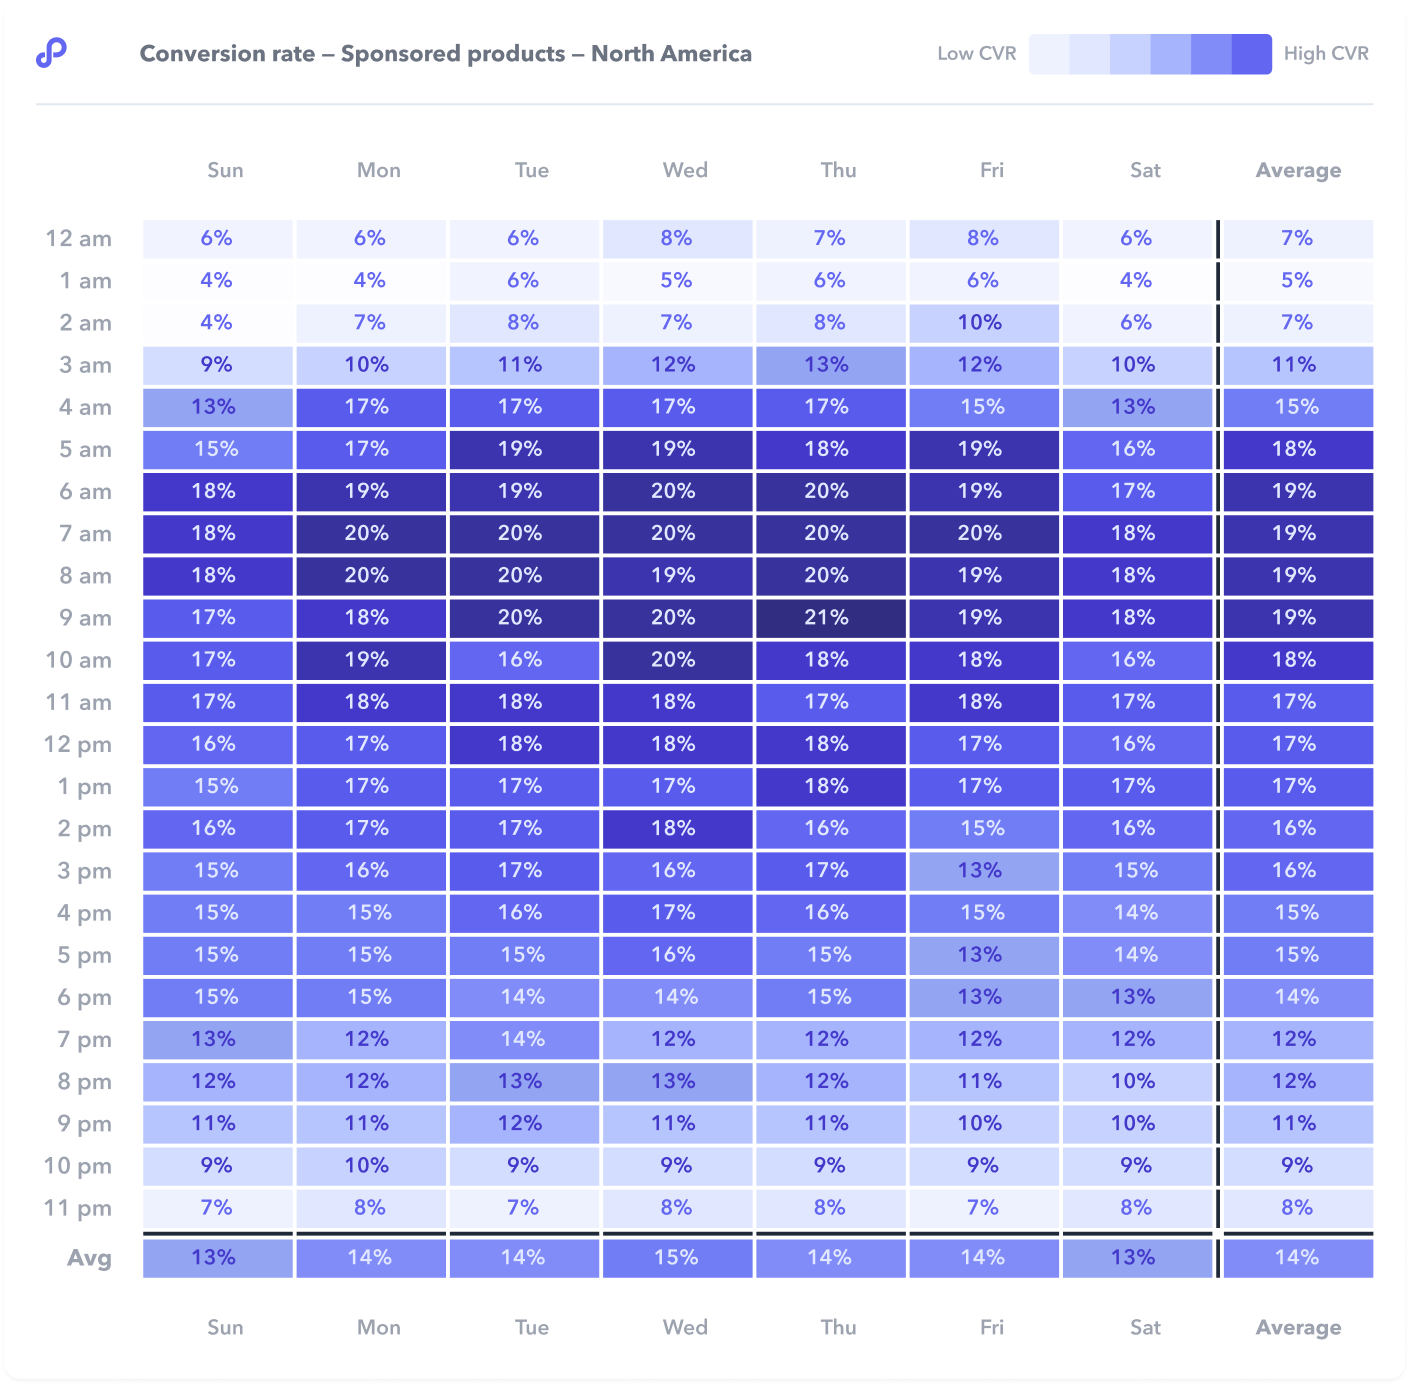
The data shows conversion rates peaking in a four-hour morning period between 6:00am and 10:00 am PST. This equates to 9:00 am - 1:00pm on the east coast and reflects the time when the majority of Americans are starting their working day. One hypothesis is that shoppers making at-work purchases tend – on average – to consider slightly fewer options than those making private purchases.
Further evidence of this would be the slight drop in conversion rates at the weekend, where it can be assumed that more people are shopping for personal reasons. Most likely shoppers are also making purchases that need more research time on the weekend and do more browsing and window shopping in general. The morning spike during the working week is significant, with conversion rates around three times higher than in the nighttime (20% vs 6-8%).
Therefore, if you are selling in a category where at-work purchases are relevant, then you could consider applying aggressive bid multipliers. This will help optimize your visibility with better ad placements and maximize sales in this key four-hour period.
Average order value
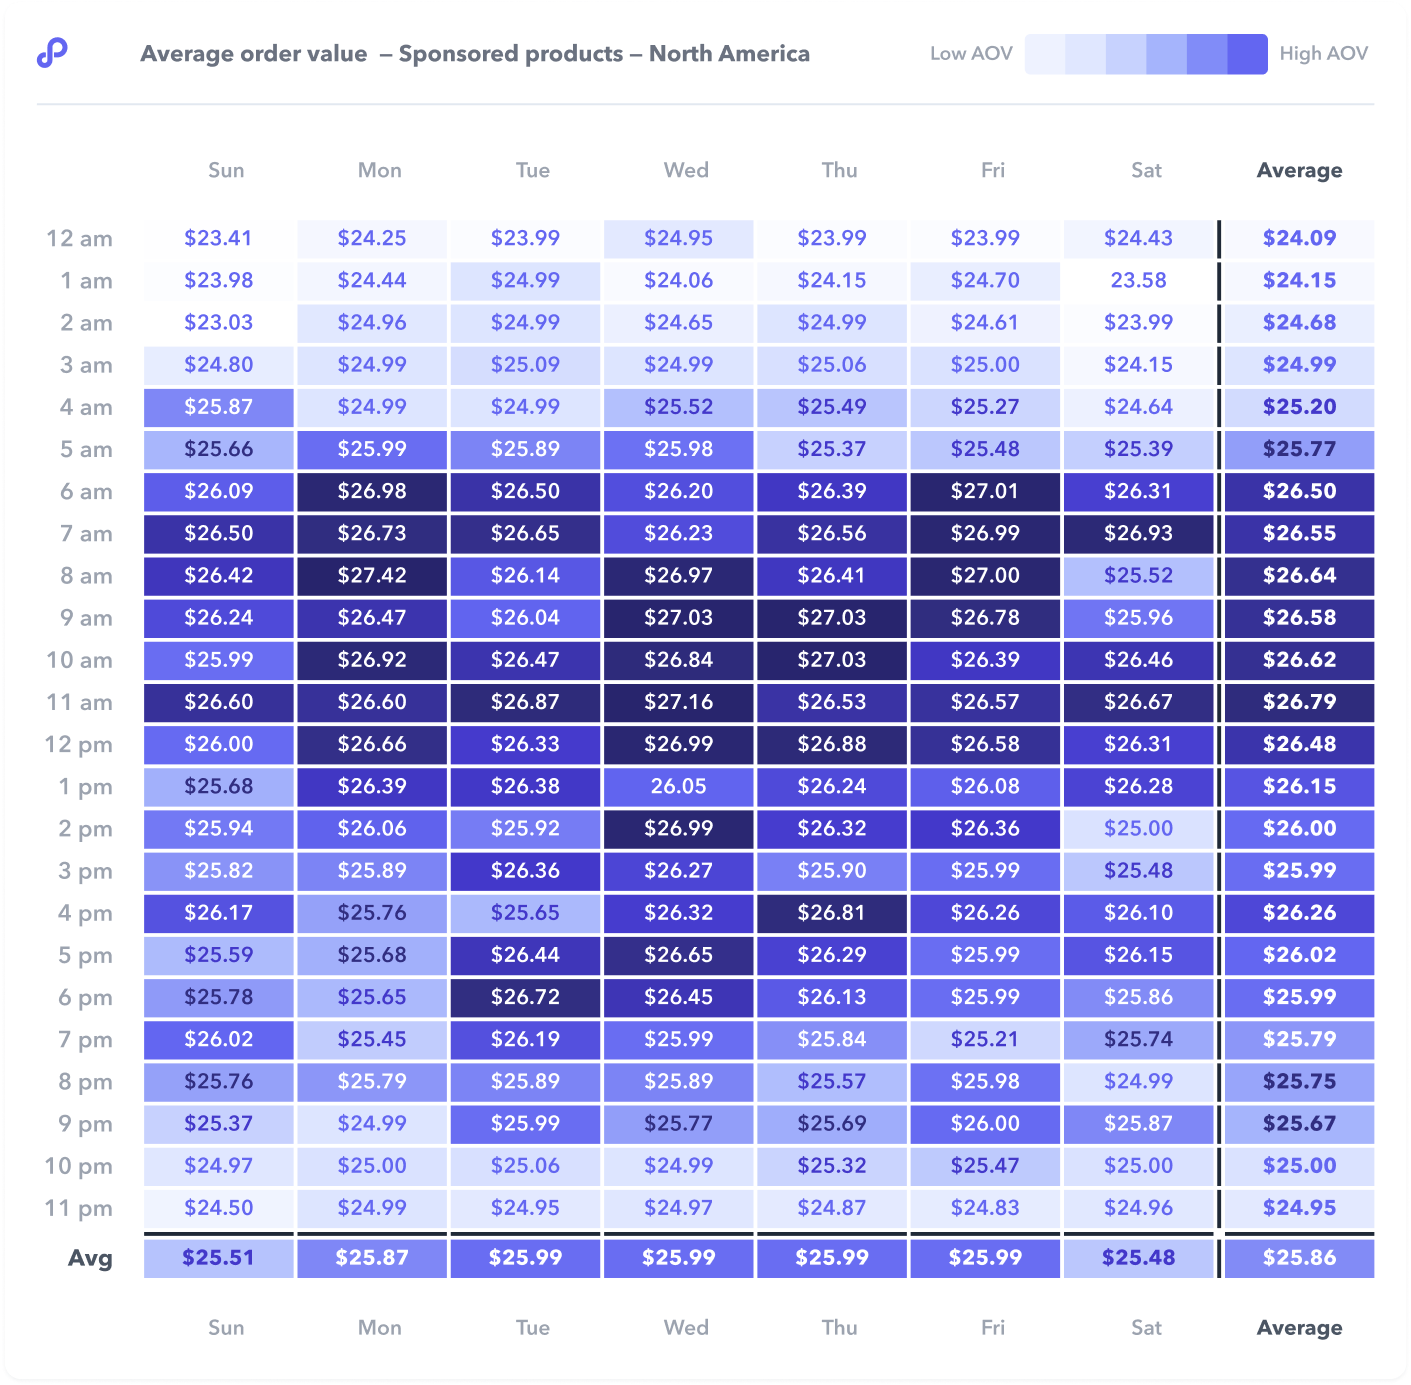
When we analyze the intraday variation of average order value benchmarks, we should do so with caution. The average order value of any sale is chiefly dependent on the price of the product being purchased, which is not something an advertiser is likely to change over the course of the day.
However, the data shows that the average order value is highest in the period starting at 6 am PST (9 am EST). This corresponds with the period of highest conversion rates, shown above, indicating a likely connection between purchases being made at work and slightly increased average order values. An analysis at category level could provide more insight into this theory, as some product categories will naturally be more heavily affected by office hours.
This general trend will not be applicable for every advertiser. Sellers are advised to study when their specific periods of highest activity are, and experiment with hourly bid multipliers to take advantage of these peak times and maximize sales.
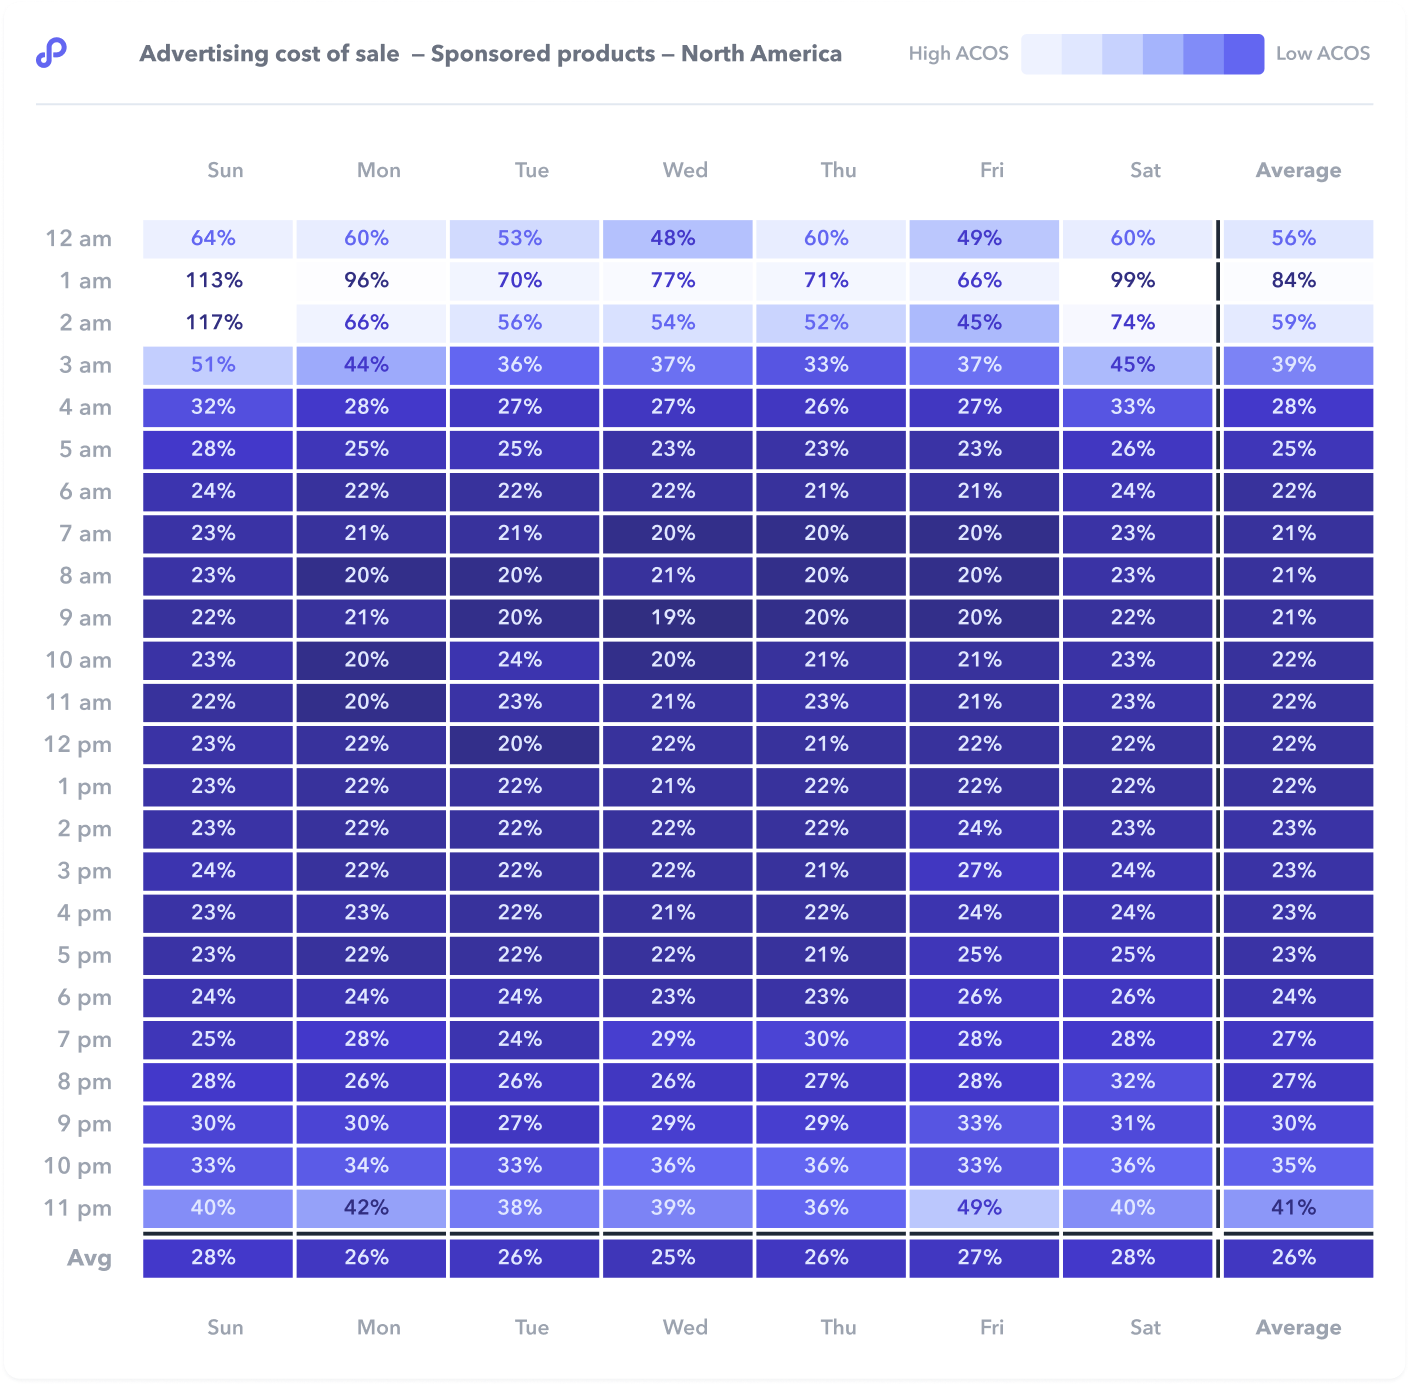
Advertising cost of sale
The hourly benchmarks for advertising cost of sale (ACOS) show that Sponsored Products ads are most profitable from 6:00am to 6:00 pm PST, or 9:00 am to 9:00 pm EST, where the ACOS ranges from 20-23%. This corresponds closely with the increase in conversion rates from 6:00am PST, with the low ACOS sustained throughout the afternoon hours by steadily falling cost per click.
However, even low cost per click is not enough to mitigate the impact of dramatically lower conversion rates towards the end of the day, with an average ACOS of 41% in the hour starting at 11:00 pm PST.
Knowing when your ad campaigns are most – and least – likely to turn the biggest profits can give you the edge over advertisers with more static bidding strategies. Bid multipliers can be applied in both directions – so you can apply a multiplier of <100% at times of high expected ACOS, and balance this out with more aggressive (i.e. >100%) multipliers to make the most of your high-profit periods.
Summary and Recommendations
TL;DR
Click-through rate: Low overall variance but slightly higher at weekends and outside working hours
Cost per click: Consistent trend of a steady fall in cost per click over the course of the day
Conversion rate: Highest during a four-hour period between 6:00 am and 10:00 am PST on workdays. Slightly lower on weekends and around three times lower in the night-time hours.
Average order value: Slightly higher during typical working hours, but variation likely closely related to product categories.
Advertising cost of sale: Most efficient from 6:00 am to 6:00 pm PST on workdays, driven by high conversion rates and sustained by falling CPC.
Strategic Recommendation: Achieve your aims with dayparting
Equipped with hourly data, advertisers can start making intelligent decisions about when and on which campaigns they want to adjust budgets (doubling down on increasing bids, or alternatively pulling back on non-performing times/days). You can then build out robust dayparting strategies to achieve your objectives with actionable data insights.
Advertisers can leverage the times of day with lower cost per click (CPC) or advertising cost of sale (ACOS), dips in share of voice (SOV), or higher sales volume. Brands can then track this performance via the Perpetua Reporting dashboard, which displays data at an ad account, campaign, and goal level by hour of the day, day of the week, or both. Such refined data allows advertisers to multiply their existing ad campaign bids via the Perpetua Stream dashboard.
For example, you can use hourly data to help maximize profitability, maximize sales, or increase share of voice:
Maximize profitability: Maximizing profitability means minimizing ACOS. By using hourly bid multipliers, you can shift your investment away from low-profit periods and focus on the specific hours of the day – or days of the week – when your campaign ACOS is lowest.
Maximize sales: With Perpetua Stream reporting, you can easily identify the times of day and days of the week when your campaigns are generating the most sales and/or share of voice across ads. If you spot high sales/impressions periods or times with a low share of voice - coupled with below-average CPC, then this is your chance to bid more aggressively and drive up sales and impressions at these peak volume periods.
Increase share of voice: Share of voice data is available only via Perpetua Stream not via Amazon Marketing Stream. Advertisers looking to increase brand visibility can use Search Insights to identify when their share of voice dips for flagship category keywords. They can then multiply their bids for those placements in existing campaigns containing their category keywords or in new campaigns which will contain other category-related keywords. Similarly, brands can also leverage hourly share of voice data to increase market share by multiplying their bids on category keywords during the relevant times of day and on the relevant days of the week, as identified with Perpetua Stream. For smaller brands who may not be dominating market share, this is a great way to stay competitive throughout the day, and capture those crucial top-of-search placements — taking advantage of the hourly SOV dips that their competitors are not optimizing for.
And finally…don't forget volume metrics
This short study has focused on ratio metrics, but volume metrics like your total ad sales, impressions and clicks are, of course, also highly important. And these will also vary throughout the day and during the week. The good thing is: you can find these – along with all the metrics included in this study – in the new Perpetua Stream feature of Perpetua advertising optimization and intelligence software.
Turn insights into actions with Perpetua Stream
At Perpetua, we’ve integrated with Amazon Marketing Stream to bring hourly performance data straight to our platform to easily analyze and identify intra-daily trends, and quickly take action on them. Perpetua Stream is currently available for Amazon marketplaces in North America.
Heatmaps viewable by goal or campaign allow you to see within seconds when your key metrics rise or fall. All advertisers need to do is choose the KPI that matters the most to them, and they can easily see what times of the day and days of the week this KPI peaks and falls. Viewing by campaign or by goal allows advertisers with fewer data points to group multiple campaigns together so that they can still leverage the benefits of intraday optimization.
Once advertisers know exactly when they need to be bidding differently, they can build schedules to increase (up to 10x) or decrease bids for each hour of the day and day of week. And once schedules are made, they can apply them to multiple goals, a single goal, or single campaigns within a goal based on their specific account objectives — all with only a few clicks.
Looking for more context? Get our complete guide to intraday reporting, with background, data, and optimization strategies here.
To get started or learn more about how Perpetua can help you scale your Amazon Advertising business, contact us at hello@perpetua.io
Top Stories