Download Report
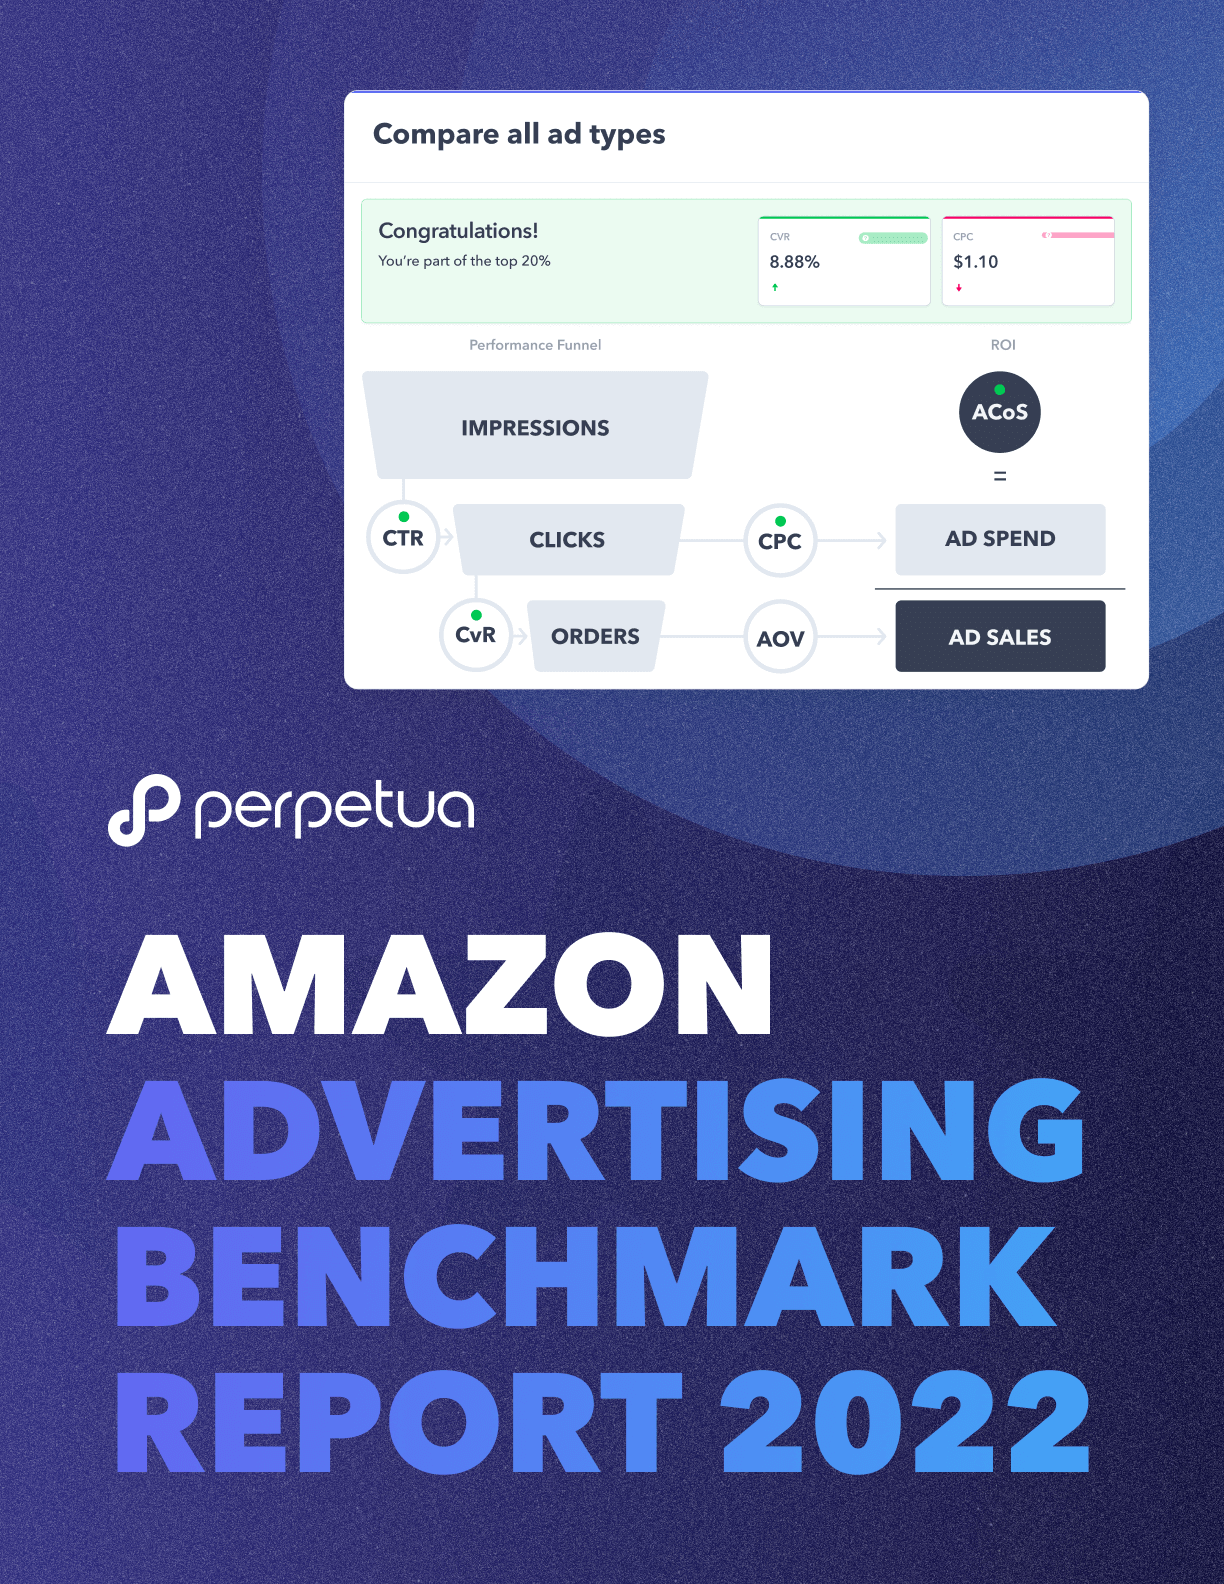
AMAZON ADVERTISING BENCHMARK REPORT 2022


Data, insights and recommendations from a study of 2 million Sponsored Products campaigns.
Amazon Advertising Benchmark Report 2022 for data, insights and recommendations from an analysis of 2 million Sponsored Products campaigns.
KEY INSIGHTS
How attractive is Amazon as an advertising platform and where do you get the best return on investment?
What’s the cost of advertising across different platforms (Amazon, Google, Facebook and more)?
How is the Amazon advertising landscape changing and how was it affected by the pandemic throughout 2020 and 2021?
How do shopper behavior and advertising performance vary in different marketplaces and in different product categories, and how can you improve your ad campaigns accordingly?
THESE ARE JUST SOME OF THE QUESTIONS ANSWERED BY SELLICS’ AMAZON ADVERTISING BENCHMARK REPORT 2022, AN EXTENSIVE BIG DATA STUDY OF MORE THAN 2 MILLION ACTIVE ADVERTISING CAMPAIGNS ON AMAZON SPANNING 7 MARKETPLACES OVER 2 YEARS.
AMAZON IS UNIQUELY ATTRACTIVE FOR B2C AND RETAIL ADVERTISERS
Global advertising costs on Amazon are still lower than on many other platforms.
With a worldwide CPC benchmark of just $0.75, Amazon compares favorably not only with Google and Facebook, but also other major players like Instagram and LinkedIn, as well as close competitor Walmart.
Read the report to find out what makes Amazon unique—not only as a retail platform but also as the number one address for online product searches.
WHAT YOUR REPORT CONTAINS
Executive summary of all key findings
How Amazon Sponsored Products compares to other PPC channels
Key milestones in Amazon Advertising
Comparison of Amazon’s international marketplaces
Detailed look at the US marketplace, including data, trends and analysis of:
Ad spend
Ad revenue
Click-through rate
Cost per click
Conversion rate
Average order value
Advertising cost of sale (ACOS)
Deep dive into benchmark KPIs for Amazon’s product categories
Walkthrough of how to work with benchmark data and identify areas of high potential for your Sponsored Products campaigns
The data and insights presented in Perpetua’s Amazon Advertising Benchmark Report 2022 are based on a wide-scale study of more than 2 million Amazon Sponsored Products advertising campaigns. Metrics, benchmarks and conclusions have been collated from anonymized data in 7 marketplaces over a two-year period from 2020 to 2021, providing both high-level trends and category-level analysis. The trends and figures in this report do not represent or indicate the official performance of Amazon and Amazon Advertising, or the experiences of any Amazon advertiser.
You're already growing so why not grow more?
